CSU Decarbonization Framework: Task 3: Design Guidelines
1. Introduction
Executive Summary
This document is intended to provide guidance for retrofitting existing fossil fuel heating systems with high efficiency low-to-no-carbon alternatives. As climate change continues to impact California, it is increasing important for campuses to understand their local weather and climate conditions and how that may differ from industry standard practices using the closes weather station. This can be used as a resource for design teams and by campus for establishing a standard for designing climate change adapted structures.
This document provides recommendations for campuses and design teams to consider when sizing no and low carbon heating systems. These can be summarized into the following actions:
- CSU Building should be operated at a temperature range of 68-78F, as required per various California State Executive Orders. Heating system should be design and sized to 68F a setpoint
- The impact of climate change on future weather conditions should be considered when
retrofitting exiting building and fossil fuel based heating system
- Develop heating / cooling design condition standards on campus based on multiple data sources (Title 24, ASHRAE, Actual Weather Data, etc.)
- Incorporate future weather conditions into energy modeling analysis
- Additional load calculations and data analysis should be provided to size heat pump heating systems to prevent oversizing and to improve the economics of decarbonizing heating systems
Background Information
ASHRAE Design Standards
The American Society of Heating, Refrigerating and Air-Conditioning Engineers (ASHRAE) provides design guidelines for building engineers. Below are the two documents that are relevant for heating system load calculations to provide a comfortable environment. These design guidelines should be followed for all CSU projects.
- ASHRAE Standard 55 – Thermal Environmental Conditions for Human Occupancy1
“The purpose of this standard is to specify the combinations of indoor thermal environmental factors and personal factors that will produce thermal environmental conditions acceptable to a majority of the occupants within the space.”
- 2017 ASHRAE Handbook, Fundamentals – Load and Energy Calculations2
The Load and Energy Calculations section includes the following chapters:
14. Climatic Design Information
15. Fenestration
16. Ventilation and Infiltration
17. Residential Cooling and Heating Load Calculations
18. Nonresidential Cooling and Heating Load Calculations
19. Energy Estimating and Modeling Methods
1 https://ashrae.iwrapper.com/ViewOnline/Standard_55-2017
2 https://www.ashrae.org/technical-resources/ashrae-handbook/table-of-contents-2017-ashrae-handbook-fundamentals
California Building Code (Title 24)
Part 6 – Building Energy Efficiency Standards provides requirements for sizing mechanical equipment. There are different requirements depending on how the project is complying with California’s Energy Code
- Mandatory Requirements: applies to all new construction and major renovation projects
- Prescriptive Requirements: only applies project comply with the prescriptive energy code compliance path. Projects with a performance compliance energy model are not subject to these requirements
Mandatory Requirements:
There are no mandatory requirements for load calculations.
Prescriptive Requirements: SECTION 140.4(b)
In making equipment sizing calculations under Subsection (a), all of the following rules shall apply:
- Heating and cooling loads: the method in the 2017 ASHRAE Handbook, Fundamentals shall be used, or as specified in a method approved by the Commission
- Indoor design conditions: ASHRAE Standard 55 or the 2017 ASHRAE Handbook, Fundamentals Volume, except that winter humidification and summer dehumidification shall not be required
- Outdoor design conditions: the design conditions from Reference Joint Appendix JA2 shall be used, which is based on data from the ASHRAE Climatic Data for Region X. Heating design temperatures shall be no lower than the Heating Winter Median of Extremes values. Cooling design temperatures shall be no greater than the 0.5 percent Cooling Dry Bulb and Mean Coincident Wet Bulb values
California Executive Orders
Current State of California and California State University Executive Orders require that buildings are operated to the following temperature set points, unless specialized needs of equipment or scientific experimentation. Building should be designed to the following temperature set points.
- Cooling Temperature Setpoint: 78F
- Heating Temperature Setpoint: 68F
State of California
EXECUTIVE ORDER B-18-12
“IT IS FURTHER ORDERED that State agencies implement the measures described in the accompanying Green Building Action Plan for facilities owned, funded, or leased by the state.”3
Per the California Department of General Services, state buildings shall be operated as follows:
“Facility managers shall allow building temperatures to fluctuate within an acceptable range to avoid wasteful over-control patterns. This range may vary with each building’s control system; the target range is plus or minus two degrees Fahrenheit from the temperature set point, for a total fluctuation of four degrees Fahrenheit. The temperature set point should be no higher than 68°F in winter and no lower than 78°F in summer; unless such a temperature in a particular job or occupation may expose employees to a health and safety risk. Simultaneous or alternate heating and cooling operations to maintain exact temperature in work areas shall be avoided.”4
California State University
Executive Order (EO) 987: CSU
“Purchased energy resources on CSU facilities will not be used to heat above 68°F or cool below 78°F. Domestic hot water temperatures will not be set above 115°F. These limits will not apply in areas where other temperature settings are required by law or by specialized needs of equipment or scientific experimentation.”5
3 https://www.green.ca.gov/Buildings/resources/executiveOrder/
4 https://www.dgsapps.dgs.ca.gov/documents/sam/SamPrint/new/sam_master/sam_master_file/chap1800/1805.3.pdf
5 https://calstate.policystat.com/policy/6589455/latest/
2. Design Condition Guidelines
The following section provides an overview of design weather conditions for the CSU system. This document uses the CSU Chancellor’s Office Headquarters building, located in Long Beach, CA, as an example of how design teams and campuses should assess climate conditions. This section includes an overview of historical, current and future weather conditions.
Historical Weather
The following section includes weather and climate data from various sources including: ASHRAE, Title 24, Typical Meteorological Year (TMY) weather files and actual weather conditions.
Design Conditions
- ASHRAE – Climatic Design Conditions 2017
- Title 24 – Appendix JA2: Reference Weather/Climate Data 2019
Weather Files
- TMY3 – weather conditions from 1991-20056
- TMYx – weather data from 1957-20187
- TMYx.2004-2018 – weather data from 2004-2018
- CA Climate Zone –weather data from 1961-1990 (TMY2), used in Title 24 compliance8
- Actual Weather – pulled from local NOAA weather station for 2015-2019
6 Users Manual for TMY3 Data Sets: https://www.nrel.gov/docs/fy08osti/43156.pdf
7 Climate/Weather Data Sources: http://climate.onebuilding.org/sources/default.html
8 Title 24 Appendix JA2 – Reference Weather/Climate Data
Design Conditions
Table 1 and Figure 1 below show the cooling design condition for the ASHRAE and Title 24 standards compared to the actual weather data for the previous five years between 2015 – 2019. Table 2 and Figure 2 show the heating design conditions. Over the past five years the actual weather conditions in Long Beach have seen similar cooling and heating design temperatures compared to ASHRAE. However, Title 24 design conditions were consistently lower and could have been based on older climate data (TMY2 – 1961-1990) which does not capture recent impacts of climate change on coastal Southern California. Using the design criteria in Title 24 JA2 Climate Conditions would oversize the heating system compared to what was required over the past 5-15 years.
| Location | ASHRAE | Title 24 | Actual Weather [2015-2019] | |||
|---|---|---|---|---|---|---|
| 99.6% | 99.0% | 99.5% | 99.0% | 99.5% | 99.0% | |
| Long Beach AP | 91.5 | 87.7 | 88 | 86 | 92 | 89 |
Figure 1: Cooling Design Conditions – Long Beach AP
| Location | ASHRAE | Title 24 | Actual Weather [2015-2020] | ||||
|---|---|---|---|---|---|---|---|
| 99.6% | 99.0% | 99.8% | 99.4% | 99.8% | 99.4% | 99.0% | |
| Long Beach AP | 40.8 | 43.1 | 38 | 41 | 41 | 44 | 45 |
Figure 2: Heating Design Conditions – Long Beach AP
The following tables and figures show the cooling and heating design conditions (99.0% - 99.9%) for various operating schedules based on actual weather data compared to design standards. If buildings are not expected to operate 24/7, campus may consider alternative design criteria for sizing low or no carbon heating equipment.
| Actual Weather [2015-2019] | Design Standards | ||||
|---|---|---|---|---|---|
| 12AM - 12AM | 6AM - 10PM | 8AM - 8PM | ASHRAE | Title 24 | |
| 99.9% | 98 | 99 | 100 | - | 97 |
| 99.6% | - | - | - | 91.4 | - |
| 99.5% | 92 | 94 | 95 | - | 88 |
| 99.0% | 90 | 91 | 92 | 87.8 | 86 |
Figure 3: Cooling Design Conditions [Time of Day] – Long Beach AP
| Actual Weather [2015-2019] | Design Standards | ||||
|---|---|---|---|---|---|
| 12AM - 12AM | 6AM - 10PM | 8AM - 8PM | ASHRAE | T24 | |
| 99.8% | 41 | 43 | 45 | - | 38 |
| 99.6% | - | - | - | 41.6 | - |
| 99.4% | 44 | 46 | 49 | - | 41 |
| 99.0% | 45 | 48 | 51 | 43.7 | - |
Figure 4: Heating Design Conditions [Time of Day] – Long Beach AP
Annual Weather Conditions
The following graph and table show the heating degree days (HDD) and cooling degree days (CDD) of various annual weather files. Heating and Cooling degree days provide method to estimate the amount of heating and cooling energy that will be required to maintain thermal comfort in building. Degree days are calculated as the difference between the average daily temperature and 65F. If the average daily temperature is 70F, 5 cooling degree days will occur (70 - 65 = 5) and if the average daily temperature is above 60F, 5 heating degree days will occur (65 - 60 = 5).
There is a significant variation between the available weather files and the actual weather conditions from 2015-2019. Any energy calculations based on the Title 24 weather file would significantly overestimate the heating and underestimate the cooling energy required. The impact of climate change has already significantly impacted the cooling and heating energy required in some areas of California.
| Title 24 (1961-1990) | TMY3 (1991-2005) | TMYx (1961-2018) | TMYx.2014-2018 (2004-2018) | Actual (2015-2019) | |
|---|---|---|---|---|---|
| Heating (HDD) | 1,570 | 1,281 | 1,359 | 1,129 | 834 |
| Cooling (CDD) | 535 | 722 | 719 | 938 | 1,540 |
Figure 5: Heating and Cooling Degree Days (HDD / CDD)
Impact of Climate Change
This section will address how climate change will impact weather conditions into the future.
Heating & Cooling Degree Days
The following images shows how the number of heating (HDD) and cooling (CDD) degree days are expected to change over the next 60-80 years. California is expected to see significantly higher cooling and less heating energy requirements on an annual basis due to the impacts of climate change.
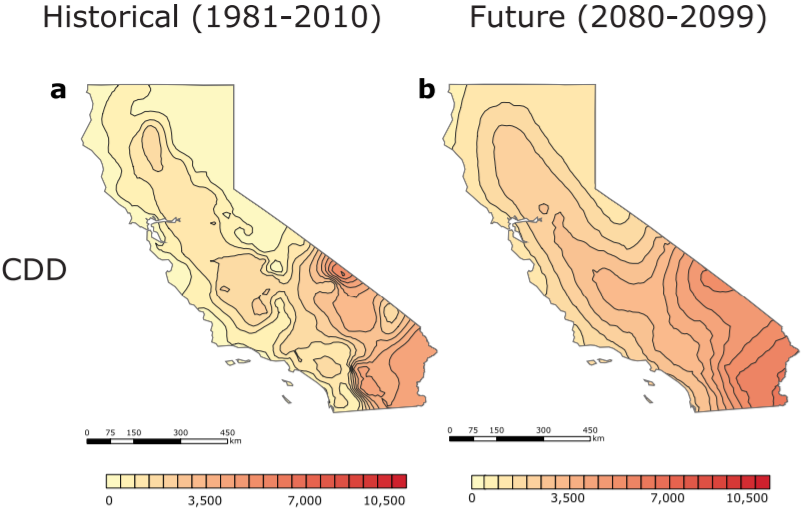
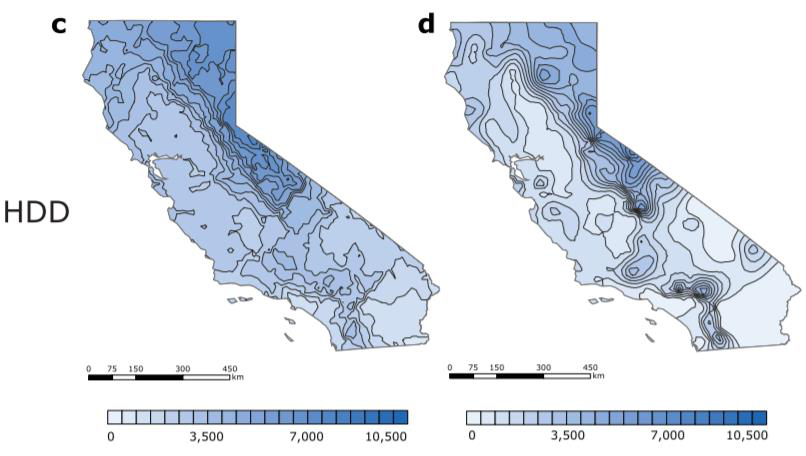
Figure 6: Heating (HDD) and Cooling (CDD) Degree Days9
The following images shows the expected impact on cooling and heating degree days in Long Beach, CA under two potential emission emissions projections (RCP – Representative Concentration Pathway).
- RCP 4.5: Emissions peak around 2040 and then decline [LEFT]
- RCP 8.5: Emissions continue to rise strongly though 2050 and plateau around 2100 [RIGHT]
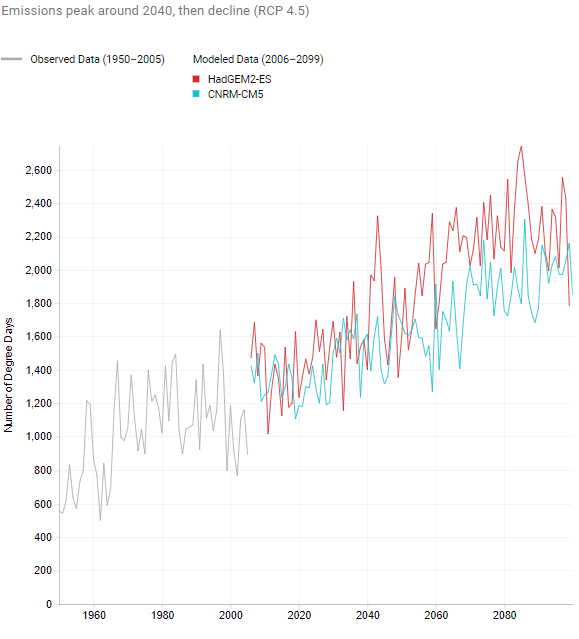
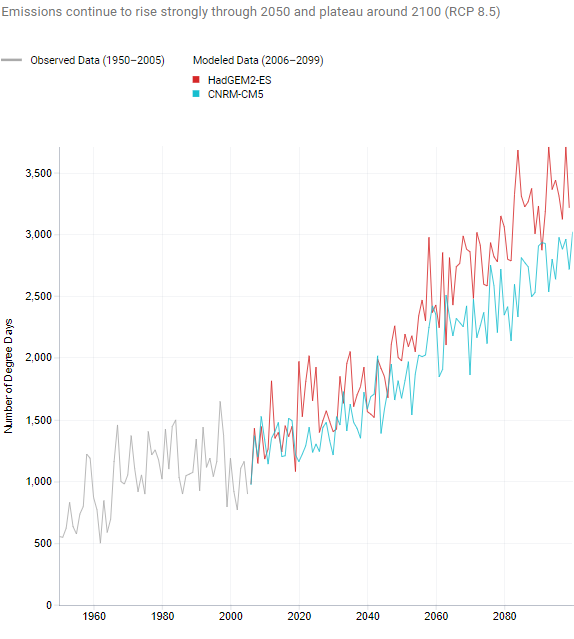
Figure 7: Cooling Degree Day (CDD) Projections – Long Beach, CA10
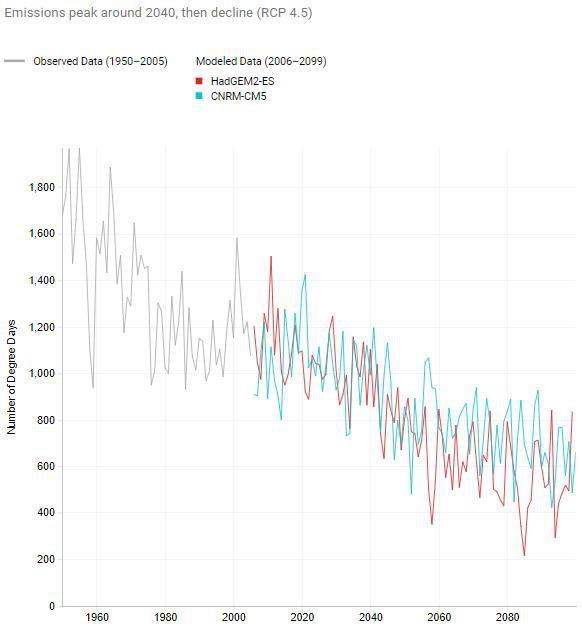
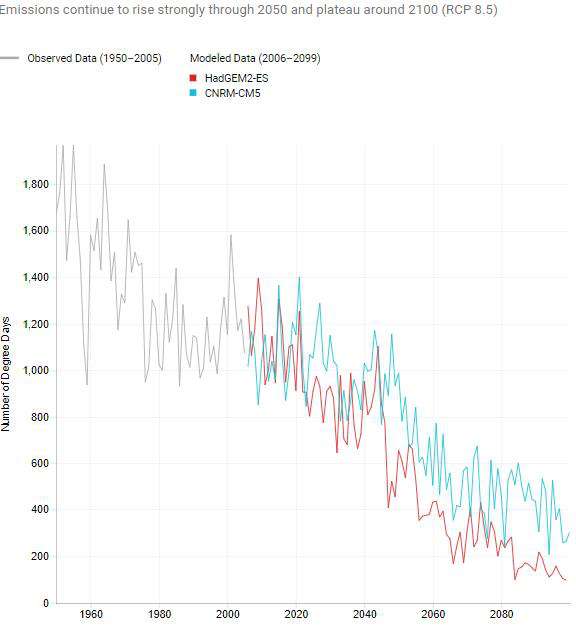
Figure 8: Heating Degree Day (HDD) Projections – Long Beach, CA
Annual Energy Impact
The 2019 Code Cycle assessed the impact climate change has already had on building energy performance. The California Energy Commission (CEC) has analyzed the same buildings across all of CA’s climate zones using data from the past 20, 15, 12, 10 and 7 years to create annual typical weather profiles (STYP). The annual cooling and heating load comparisons are shown below.
During that period the Long Beach, CA (Climate Zone 6) saw a 60-80 reduction in heating load and a ~200% increase in cooling load. This trend is expected to continue as climate change continues to impact the CSU system.
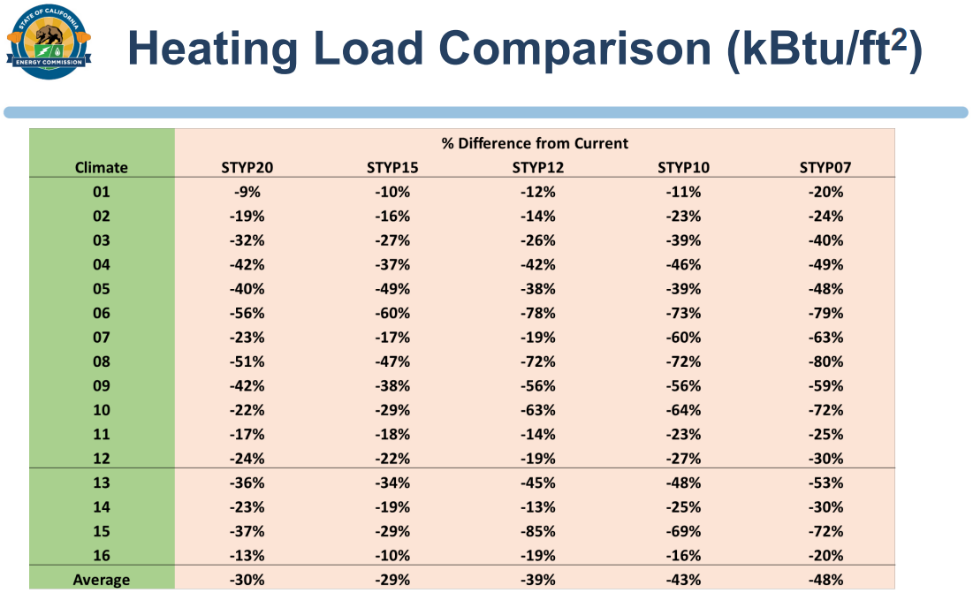
Figure 9: Heating Energy – Current (2020) vs. Historical (Past 20, 15, 12, 10 and 7 years)11
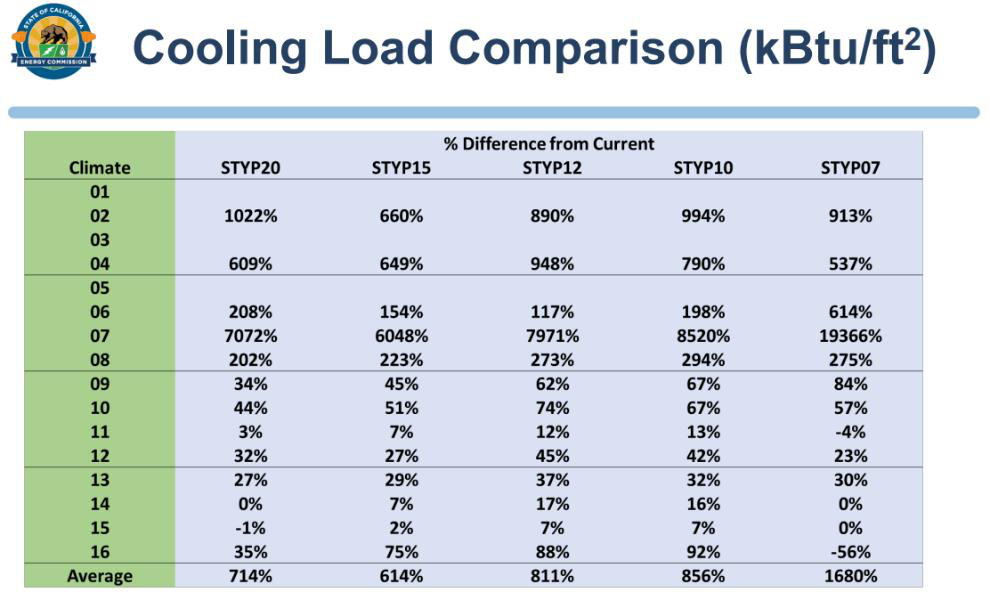
Figure 10: Cooling Energy – Current (2020) vs. Historical (Past 20, 15, 12, 10 and 7 years)11
11 2022 Energy Code Pre-Rulemaking | Presentation - Weather Data for 2022 Standards | California Energy Commission
3. Equipment Sizing Guidelines
As outlined in the prescriptive requirements of Title 24 Part 6, Section 140.4(B), heating load calculations for the CSU System should be based on ASHRAE Standard 55 and 2017 ASHRAE Handbook, Fundamentals. ASHRAE Handbooks are updated every 4 years, and therefore it is recommended that the 2021 ASHRAE Handbook, Fundamentals, is used when available. There are however known issues where heating systems can be oversized and underutilized which should be addressed by campuses and design teams as the CSU systems transition towards decarbonized heating systems, which are typically more expensive compared to existing fossil fuel based systems. Properly sizing low to no carbon heating equipment will be critical for the CSU system to cost effectively transition away from fossil fuel. This section provides recommendations for campus and engineers to consider for incorporating into the design process.
Existing Conditions
Oversized Heating System
The actual heating loads seen at a building are often significantly lower compared to the design heating capacity. The following figure shows the actual heating load breakdown of a typical CSU academic building located in Southern California. This general trend can be found in most buildings. It is recommended that design teams and campuses understand the heating distribution of existing building on camps to inform the design of new construction and major renovation projects.
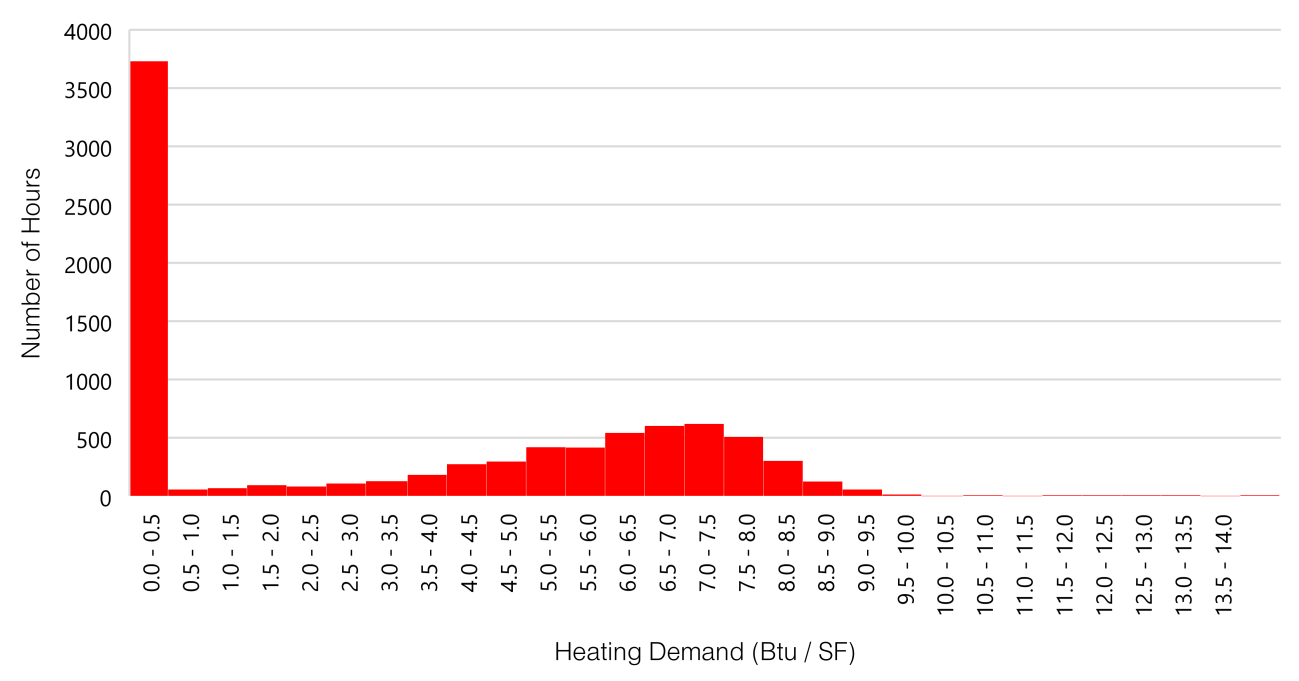
Figure 11: Heating Demand Distribution – Academic Building – Southern California
Potential Causes of Oversized Heating System
Outlined below are potentially reasons why ASHRAE Fundamentals heating load calculations can cause heating systems to be oversized and underutilized.
- Hours of Operation
Heating design temperatures are based on ASHRAE and Title 24 guidelines which assume 24/7 operations. Most buildings on CSU campuses will be unoccupied and shutdown at night which adjusts their true 99.6% design conditions. The design heating conditions will not coincide with a time when the building is operational with the HVAC system either off or in setback mode.
- Internal Loads
Heating load calculations assume there are zero interior loads within the building. Even during off hours there will be some interior electrical loads including miscellaneous plug loads, emergency lighting, etc
- Ventilation Rates
Load calculations are based on maximum ventilation rates. Peak heating events for CSU buildings typically occur during morning warm up where buildings would have unoccupied or minimally occupied buildings. With demand controlled ventilation (DCV) provided in new buildings, the actual ventilation rates are likely much lower
- Safety Factors & Diversity
Load calculations include safety factors for sizing heating elements and the overall building heating load is often rounded up. Mechanical designers also do not always account for diversity of heating loads when sizing equipment.
Recommended Process
It is recommended that the CSU system establish a “Low / No Carbon Heating Load Calculations” when sizing heating system for individual buildings, or smaller groups of buildings. Outlined below is a potential workflow and process for sizing decarbonized heating equipment.
-
1. Standard HVAC Load Calculation
- Used to size zone system heating elements
- Used to understand the maximum potential building heating load
- Method: ASHRAE Standard 55 and 2017 ASHRAE Handbook, Fundamentals
-
2. Low / No Carbon Heating Load Calculations
- Used to size capitally intensive low/no-carbon heating equipment
- Intended to make design teams think about the actual heating loads a building will experience
- Method: incorporates various data sources to inform more realistic load assumptions
- Existing building operational data
- Adjusted load calculations
- Energy modeling results
The following table provides a more detailed overview of alternative methods for properly low to no carbon heating equipment.
| Standard Load Calculations | Decarbonized Heating System – Load Calculations | |||||
|---|---|---|---|---|---|---|
| Modified Load Calculations | Energy Model | Historical Data | ||||
| Morning Warmup | Off Hour | Occupied Hours | ||||
| OSA Temperature | Campus Standard | Campus Standard | Campus Standard | Campus Standard | Campus Standard | N/A |
| Heating Setpoint | 68F | 68F | Setback Temp (ex. 60F) | 68F | 68F | |
| Ventilation | ASHRAE Handbook, Fundamentals | None | DCV - Minimum | Required Ventilation | Energy Model Inputs | N/A |
| Envelope | Per Design | Per Design | Per Design | |||
| Internal Gains | Off Hours Loads | Off Hours Loads | Occupied Loads | |||
| Safety Factor | ASHRAE Standard | ASHRAE Standard | ASHRAE Standard | |||
| Initial Interior Space Temperature | Minimum Space Temperature (off hours setback) | 68F Space Temperature (post warmup) | 68F Space Temperature (post warmup) | |||
| Existing Building Heating Data | N/A | N/A | N/A | N/A | N/A | Similar Buildings |
| Used to Size: | 1) Zone Systems 2) Full Building Heating Load |
1) No-Low Carbon Heating Equipment* | ||||
*Used to size more capitally intensive no/low carbon heating equipment (ex. air-to-water heat pumps)
Additional Considerations:
- Off Hour loads should be based on existing building electrical load data if possible
- Historical data should be based on existing building multiple building, over multiple calendar years if possible
- Energy model heating load should be based on hourly maximum heating with and additional safety factor
- Campus Standard OSA Temperature should be established based on current weather conditions and climate change projections
Lifecycle Cost Analysis (LCCA)
As the climate changes, design conditions for heating systems need to be reevaluated to optimize system sizing to be both sustainable and financially beneficial. Oversizing heating equipment results in inefficient equipment cycling, that also reduces the life of equipment. And often additional heating capacity and redundancy is built into the designs. Optimally sizing all heating equipment is particularly important as campuses move forward with decarbonizing. Campus should be aware when this is the case and understand the financial cost to evaluate.
It is important for engineers to provide a life cycle cost analysis to determine what is the optimal capacity for the low / no carbon heating equipment. This should consider various heat pump capacities and include the following:
- Capital Cost (mechanical, electrical, etc.)
- Operational Cost (utilities, O&M, etc.)
- Carbon Cost (offsets to meet carbon reduction goals, if required)
4. Thermal Comfort Guidelines
To comply with Executive Order B-18-12 & 987 it is recommended that campuses adopt a thermal comfort policy with temperature set point range between 68 – 78F for all buildings without stringent temperature or humidity requirements. Additional operational and design strategies can be provided by campuses to improve thermal comfort through modification of air flow, shading from direct sunlight, and apparel choices, among others. These strategies should be explored when necessary to allow for a 68 – 78 F spaces temperature set point range to be achieved.
5. Design Resources
Listed below are additional resources for weather files, actual weather data and climate change projects that design teams and campus can utilize.
Weather Files
- Typical Meteorological Year (TMY) 3
Weather files based on weather conditions from 1991-2005
https://rredc.nrel.gov/solar/old_data/nsrdb/1991-2005/tmy3/ - TMYx
Weather files based on weather conditions from 1957-2018
http://climate.onebuilding.org/sources/default.html - TMYx.2004-2018 recommended resource
Weather files based on weather conditions from 2004-2018
http://climate.onebuilding.org/sources/default.html - CA Climate Zone
Weather files based on weather data from 1961-1990 (TMY2). Used in Title 24 compliance
https://ww2.energy.ca.gov/title24/2016standards/ACM_Supporting_Content/
http://bees.archenergy.com/weather.html
Weather Data
- NOAA Local Climate Data recommended resource
Climate Change
- Cal Adapt recommended resource
Provides a view on how California could be impacted by climate change, including weather data projections. Developed by the state’s scientific and research community, and funded by the California Energy Commission (CEC). Includes local data for all CSU campus locations
https://cal-adapt.org/ - Weather Shift
Provides weather data based on climate change projections. Only include major California city
http://www.weather-shift.com/