Staff Assembly Budget Presentation

October 29, 2025

Fresno State graduates celebrate with their caps raised in the air.

Professional Experience

Logos of organizations and institutions associated with professional experience, including Trine University, Indiana Commission for Higher Education, indy.gov, Butler University, Ball State University, Cornell University, Ivy Tech Community College, and Indianapolis Business Journal.

Overview

  • Fresno State Financial History
  • Current State of Fresno State Finances
  • Future Financial Plan / Economic Indicators
  • Students & Opportunities
  • Budget Resources

Fresno State Financial History

General Fund Balance
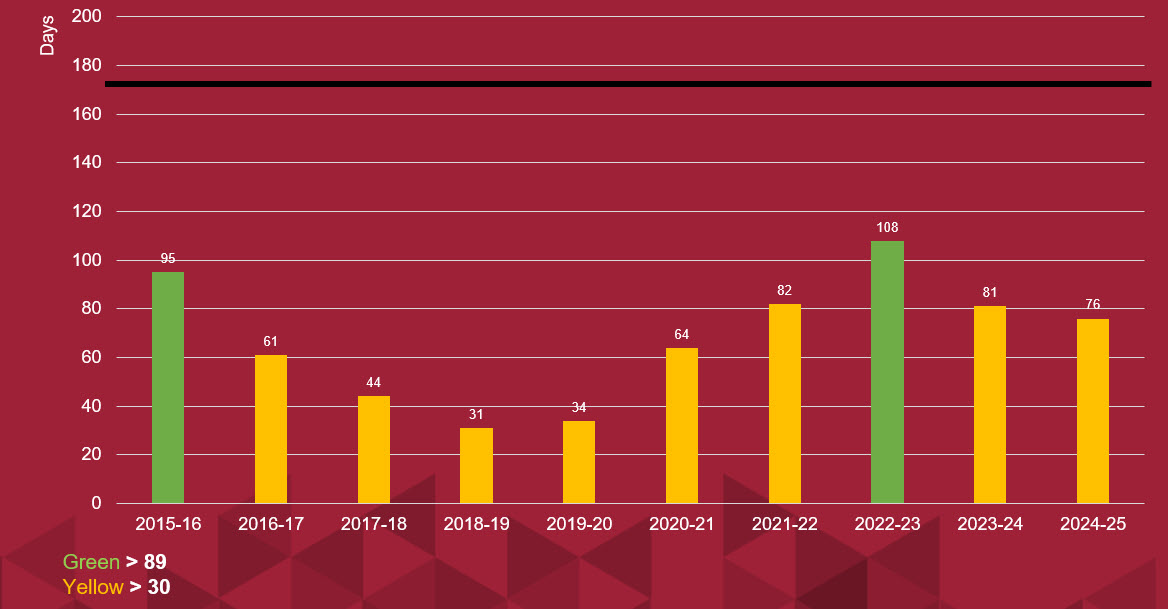
General Fund Balance in days by fiscal year: 2015-16, 95; 2016-17, 61; 2017-18, 44; 2018-19, 31; 2019-20, 34; 2020-21, 64; 2021-22, 82; 2022-23, 108; 2023-24, 81; and 2024-25, 76. Green is greater than 89 days; yellow is greater than 30 days.

Operating Margins

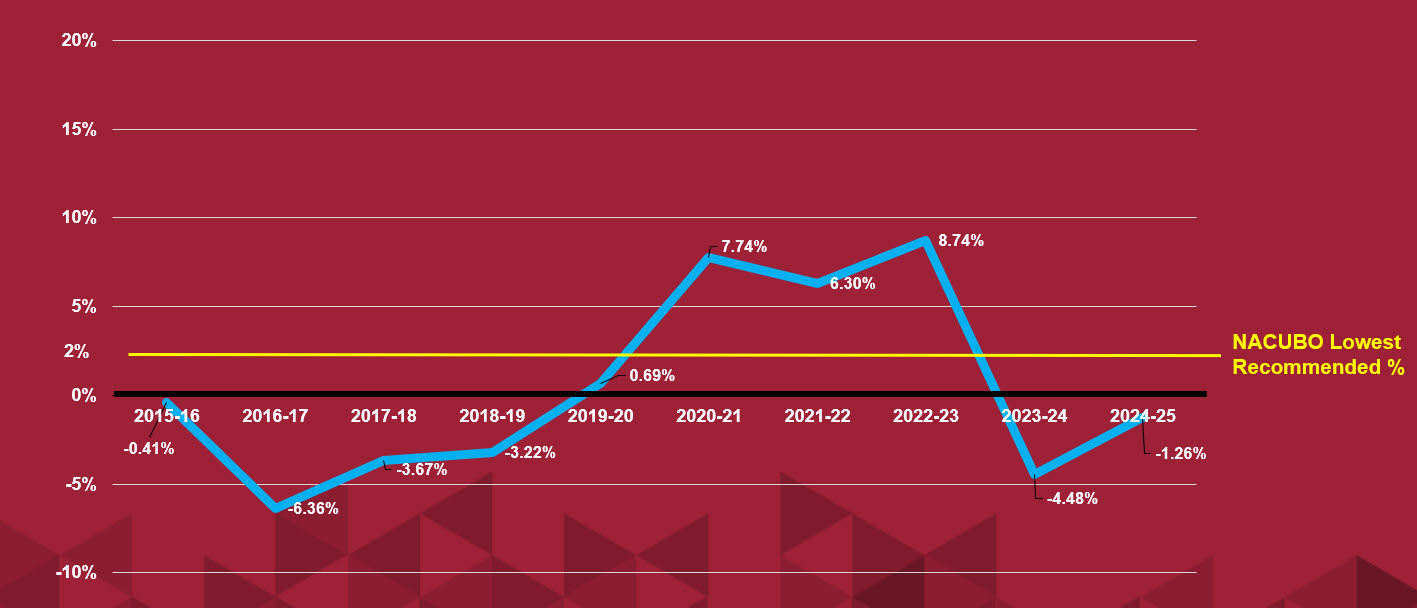
Operating margins by fiscal year: 2015-16, -0.41%; 2016-17, -6.36%; 2017-18, -3.67%; 2018-19, -3.22%; 2019-20, 0.69%; 2020-21, 7.74%; 2021-22, 6.30%; 2022-23, 8.74%; 2023-24, -4.48%; and 2024-25, -1.26%. A line marks the 2% NACUBO lowest recommended margin.

FY 2025-26 and FY 2026-27 Budget

FY 2025-26 and FY 2026-27 Budget
FY 2025-26 Amount FY 2026-27 Amount
Projected Expenses $(100) Projected Expenses $( 99)
Projected Revenue $ 100 Projected Revenue $ 100
Carryforward $ 200 Reserve $ 200
Actual Expenses $(125) Actual 2026 Expenses $( 99)
Carryforward to FY 2026 $ 175 Reserve to FY 2027 $ 201

Deferred Maintenance

Calendar Year

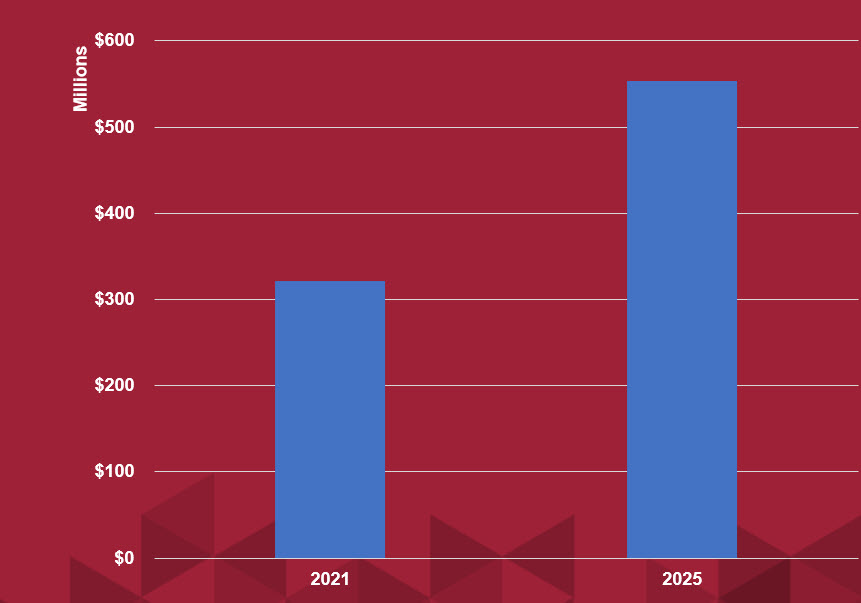
Bar chart comparing deferred maintenance in millions by calendar year. The amount rises from approximately $320 million in 2021 to approximately $560 million in 2025.

Fresno State Current FY 2025-2026

Overview of Budget Allocation to Campus
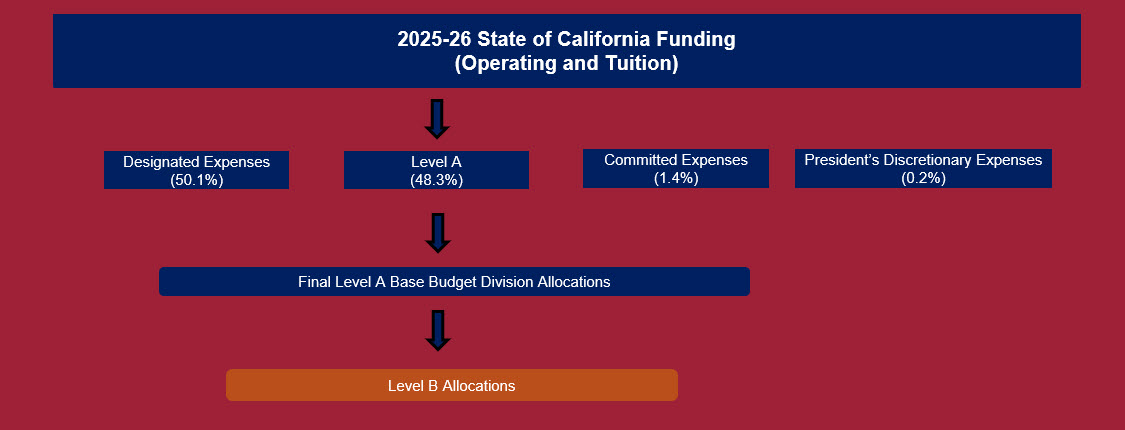
Flow diagram of 2025-26 State of California funding for operating and tuition. Funding is divided into Designated Expenses (50.1%), Level A (48.3%), Committed Expenses (1.4%), and President’s Discretionary Expenses (0.2%). Level A funds flow to Final Level A Base Budget Division Allocations, then Level B Allocations.

Notes:

Designated Expenses Benefits Pool, Risk Pool, SUG, Utilities

Committed Expenses Health Center and Professional Programs

Tuition/Fees:

  • 2025 26 estimated to be approximately $157m
  • 2024 25 over allocated by $2m;
  • 2023 24 over allocated by $6.5m

FY 2025-26 Budget
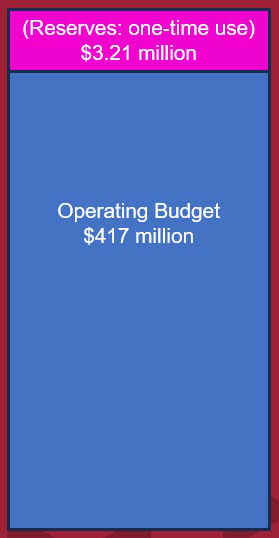
FY 2025-26 budget diagram showing an Operating Budget of $417 million and Reserves for one-time use of $3.21 million.

2025-26 CO Loan for Employee Bonuses

CSU $144 million loan from State of California

IRA Fee Allocations

Total Projected Fee Revenues: $11,385,000
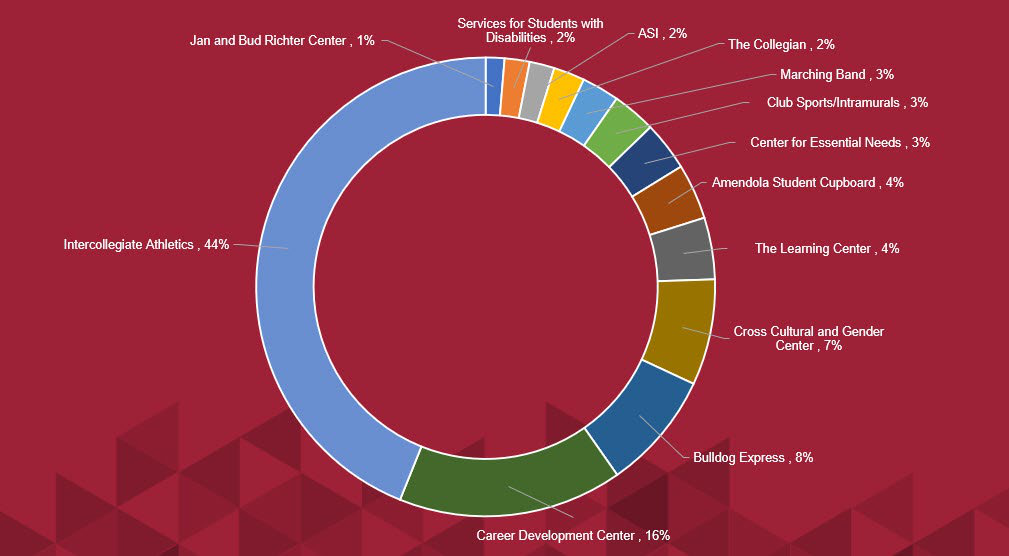
IRA fee allocation chart: Intercollegiate Athletics, 44%; Career Development Center, 16%; Bulldog Express, 8%; Cross Cultural and Gender Center, 7%; The Learning Center, 4%; Amendola Student Cupboard, 4%; Center for Essential Needs, 3%; Club Sports/Intramurals, 3%; Marching Band, 3%; ASI, 2%; The Collegian, 2%; Services for Students with Disabilities, 2%; and Jan and Bud Richter Center, 1%.

Fresno State Moving Forward

WSCUC Recommendations

  • 5 Year Budget Projection Plan
  • Strategic Plan Goals

Campus as an Enterprise

Example using 2024-25 Revenue data

Auxiliaries/Foundation $61 million

Athletics $42 million

University $411 million

Structurally Balanced Budget

(recurring costs are covered by recurring revenue)

What we are doing:

Continuing to advocate for restored state funding

Reducing General Fund Expenses:

  • Review of all leases and property rental
  • Fleet reductions – saving on insurance and maintenance costs
  • Removal of surplus mobile trailers
  • Review of student fee structure

Beginning in 2026-2027:

  • Carryforward funds will be moved centrally for one-time use funds only
  • Budget will have a planned 0% operating margin (projected revenues = projected expenses); no funding of capital
  • Monthly check-ins with Divisions

2027-2028 – add $4.1 million to reserve

Fresno State Enrollment
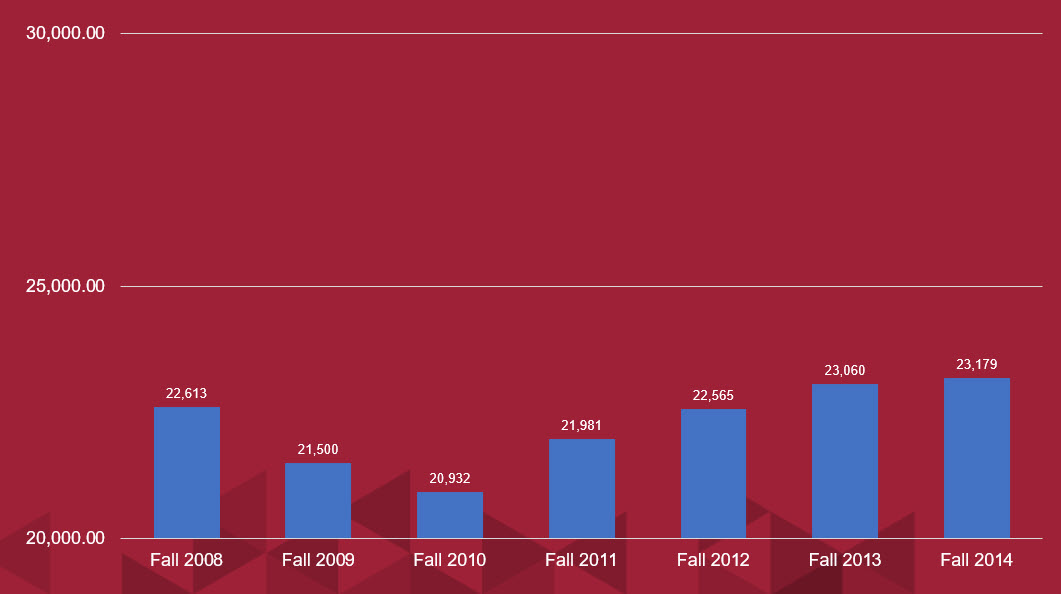
Fresno State enrollment by fall term: 22,613 in Fall 2008, 21,500 in Fall 2009, 20,932 in Fall 2010, 21,981 in Fall 2011, 22,565 in Fall 2012, 23,060 in Fall 2013, and 23,179 in Fall 2014.

Labor Force Participation

(Civilian)

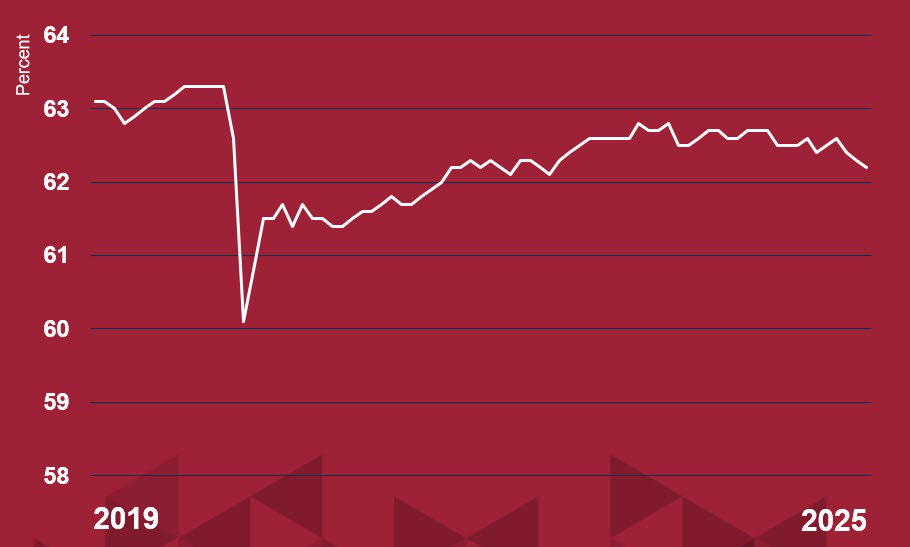
Line chart showing civilian labor force participation from 2019 through 2025. The rate starts around 63%, drops to about 60% during 2020, then generally rises and ends around 62% in 2025.

Unemployment Rate

(Civilian)

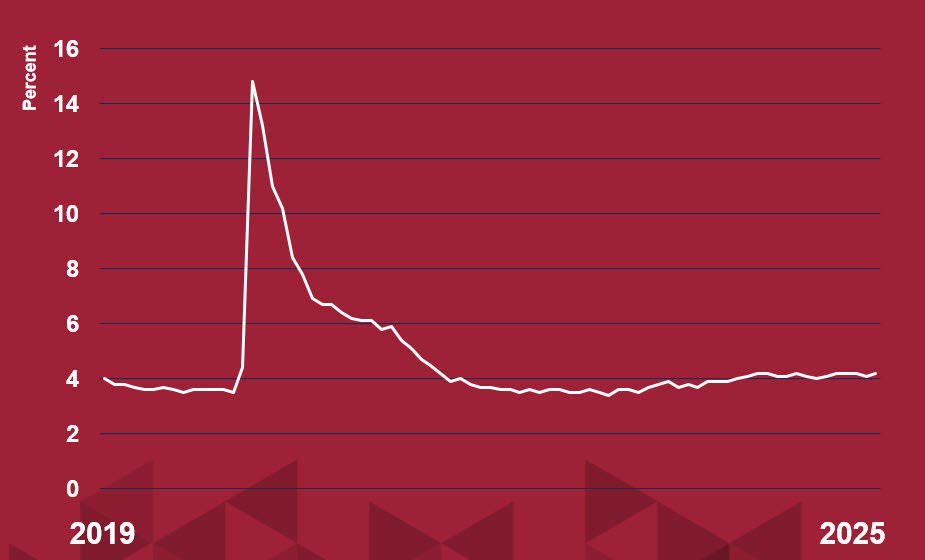
Line chart showing the civilian unemployment rate from 2019 through 2025. The rate rises sharply to about 15% in 2020, then declines and remains near 3% to 4% through 2025.

Average New Jobs Added by Month

(thousands)
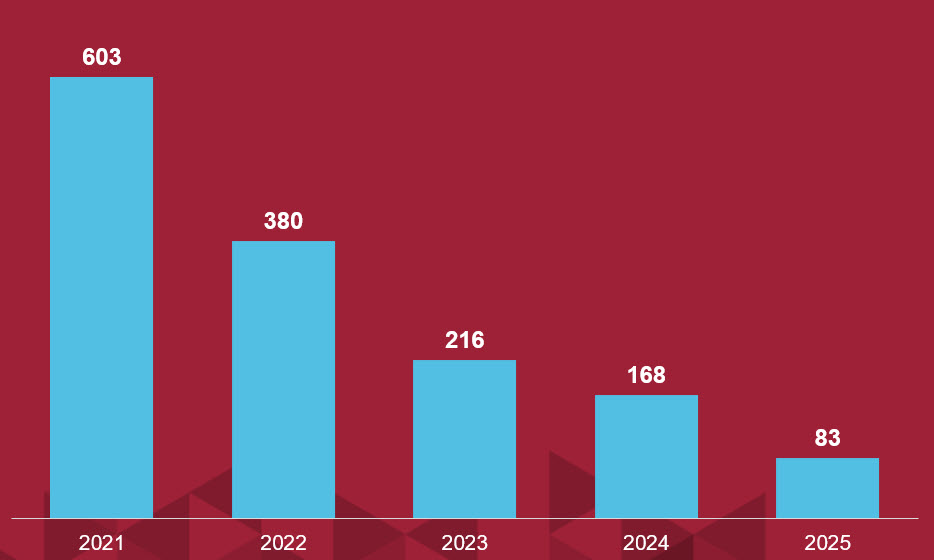
Average new jobs added by month, in thousands: 603 in 2021, 380 in 2022, 216 in 2023, 168 in 2024, and 83 in 2025.

Allocable Operating Budget Plan

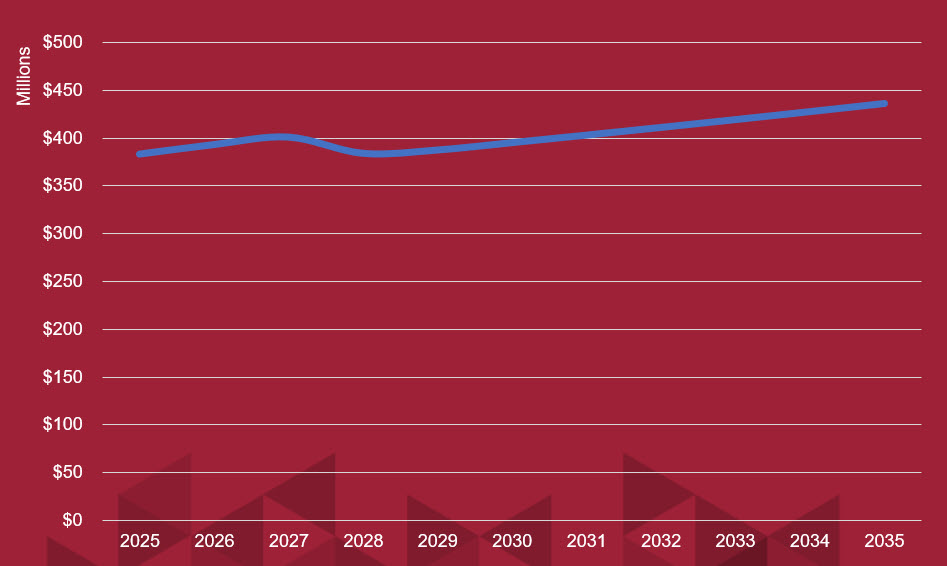
Line chart showing the allocable operating budget plan in millions from 2025 through 2035. The line starts near $380 million, dips slightly around 2028, and trends upward to approximately $435 million in 2035.

Planned Reserves & Deferred Maintenance Funding
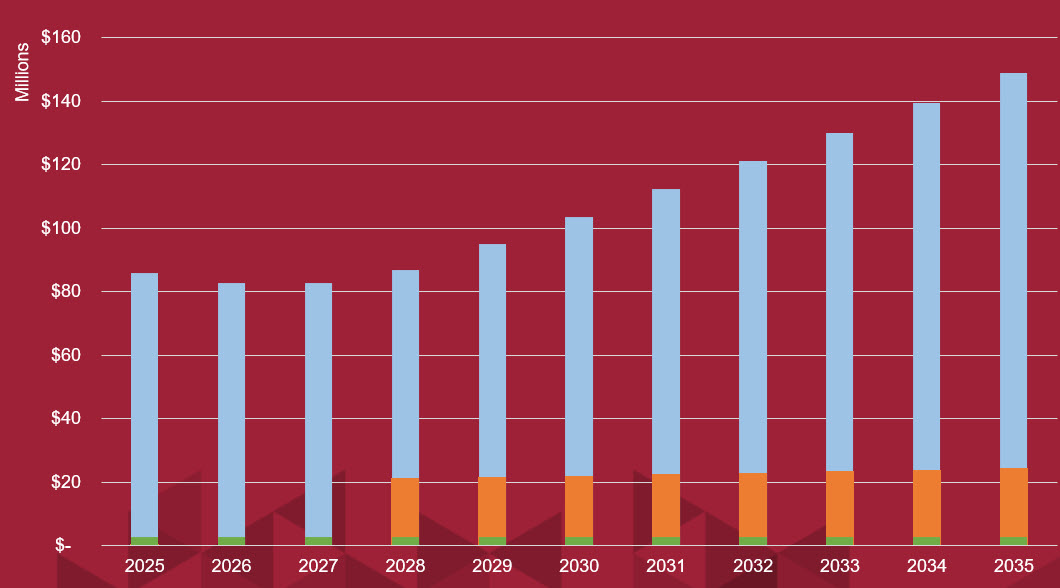
Stacked bar chart of planned reserves and deferred maintenance funding in millions from 2025 through 2035. Total funding is roughly $85 million in 2025, falls slightly in 2026 and 2027, then increases over time to approximately $150 million in 2035.

Fresno State Students and Opportunities

Fresno State Enrollment
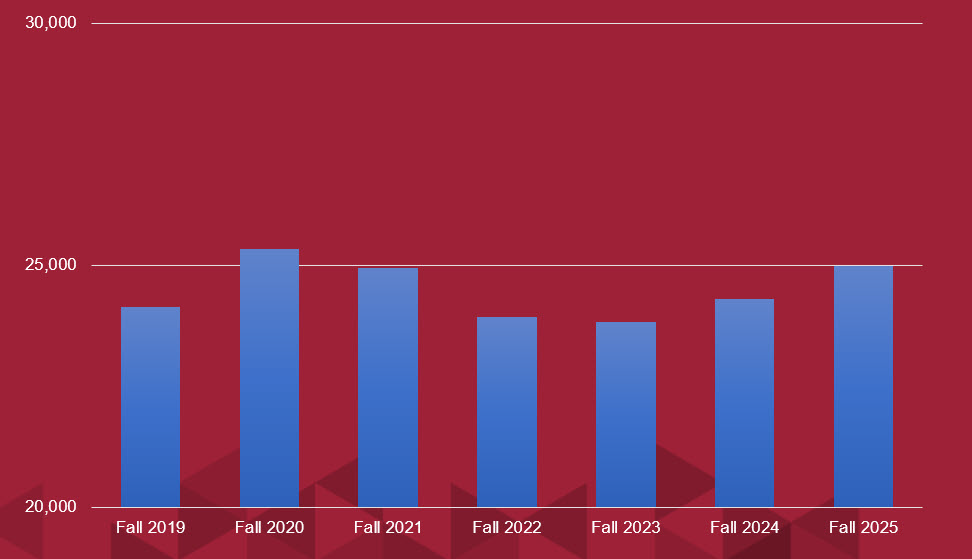
Fresno State fall enrollment bar chart for Fall 2019 through Fall 2025. Enrollment rises from 2019 to a high in 2020, declines through 2023, then rises in 2024 and 2025.

Credit Hours

  • 39% 15+
  • 46% 12-14
  • 15% PT

Employees and Students

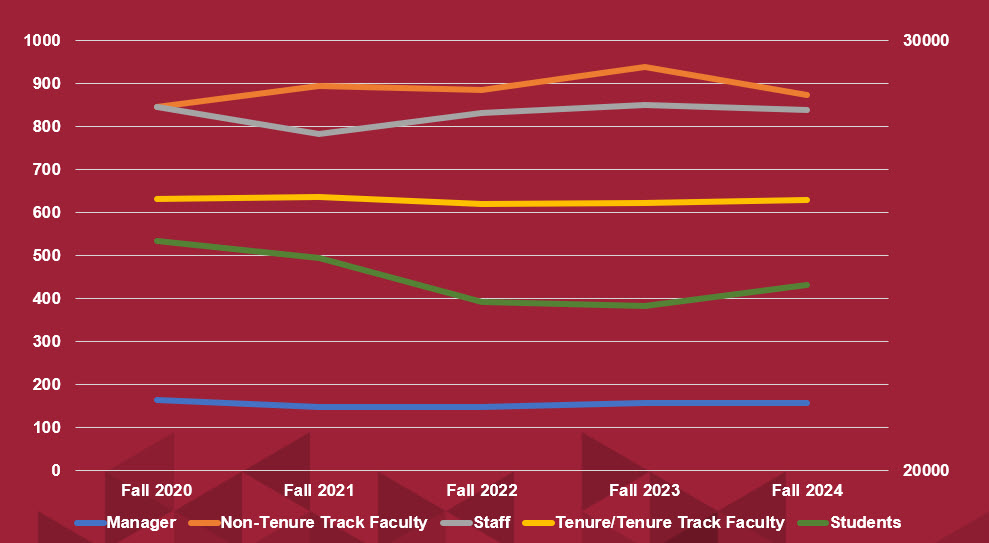
Line chart comparing Managers, Non-Tenure Track Faculty, Staff, Tenure/Tenure Track Faculty, and Students from Fall 2020 through Fall 2024. Student counts decline through Fall 2023 and rise in Fall 2024; the other employee categories remain comparatively steady.

Resources

Budget Webpage

Visit the Budget and Resource Planning webpage

Updated data available next week:

Supplemental Slides for this presentation:

  • CSU Final Budget Allocation Summary
  • Centrally Managed Funds
  • Reserve for Economic Uncertainty Allocations
  • Benefit Expenditures
  • Level A Division Allocations
  • Links to Auxiliary Budgets


Follow-up Items – May Academic Senate Budget Presentation

Search Firm Expenditures
Calendar Year Amount
2020 $ 187,236
2021 $ 150,726
2022 $ 154,176
2023 $ 456,585
2024 $ 465,890
2025* $ 69,737
Legal Fees
Year Amount
2020-21 $ 468,751
2021-22 $ 412,002
2022-23 $ 558,014
2023-24 $ 658,332
2024-25** $ 2,586,351

* As of October 1

** Includes $2 million towards the Central Plant settlement

Thank You

Fresno State graduates celebrate with their caps raised in the air.

Download the PDF

This PDF is provided as a print-only reference document and may not be fully accessible to users of assistive technology. For more information, please visit Title II Rule on Digital Accessibility page.