Data Warehouse: Financial Reporting & Transaction Inquiry Overview
Data Warehouse Financial Reporting & Transaction Inquiry Overview
Sources:
Office of Budget & Resource Planning
Accounting Services
Chancellor’s Office
California State University, Fresno – Office of Budget & Resource Planning
Finance Data Warehouse Phase 2 Upgrade
- One of the main features of Finance Data Warehouse Phase 2 upgrade is the consolidation
of three “Data Warehouse” dashboards – Manage My Budget, Operations, and Management
Reporting – into two streamlined dashboards:
- Financial Reporting – Manage My Budget, Management Reporting, and Operations report pages have been consolidated/relocated here with enhanced functionality.
- Transaction Inquiry – all transaction inquiry pages are now located on this dashboard with a wider arrangement of filters and column selectors.
- NOTE: Data is one day old!
Log in to the Data Warehouse
- Log into My Fresno State Portal
- Select CFS Datawarehouse
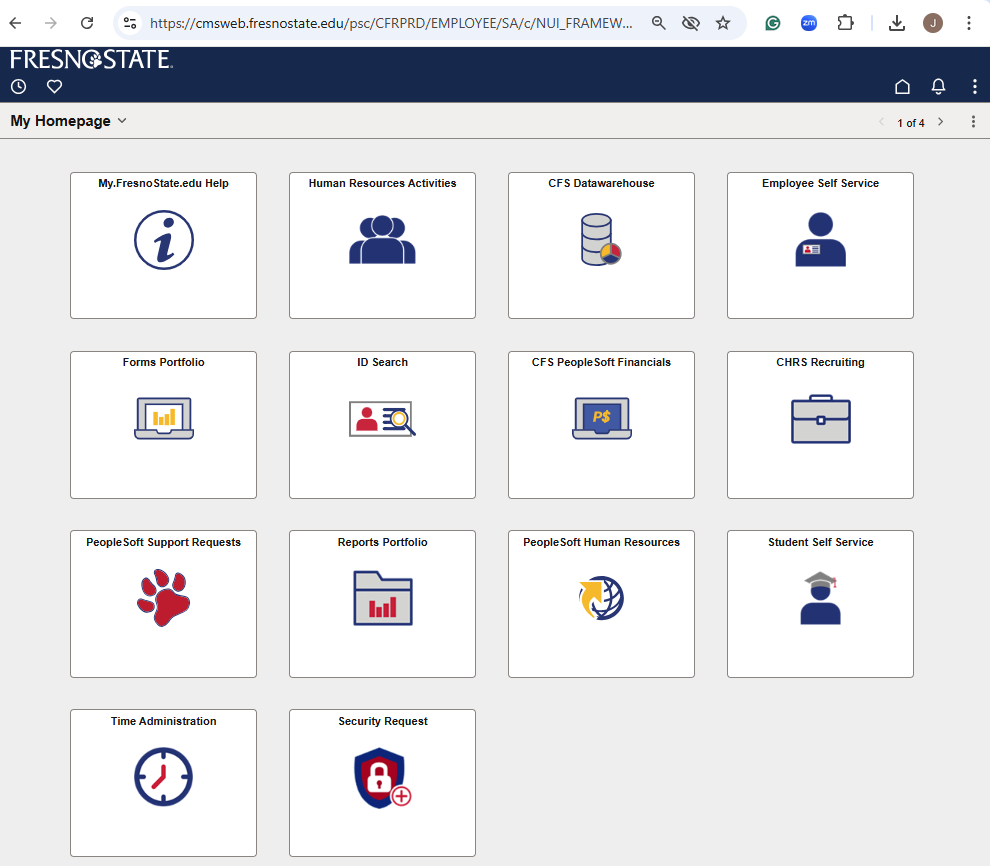
Log in to the Data Warehouse
- Below is the default screen with Dashboard icons
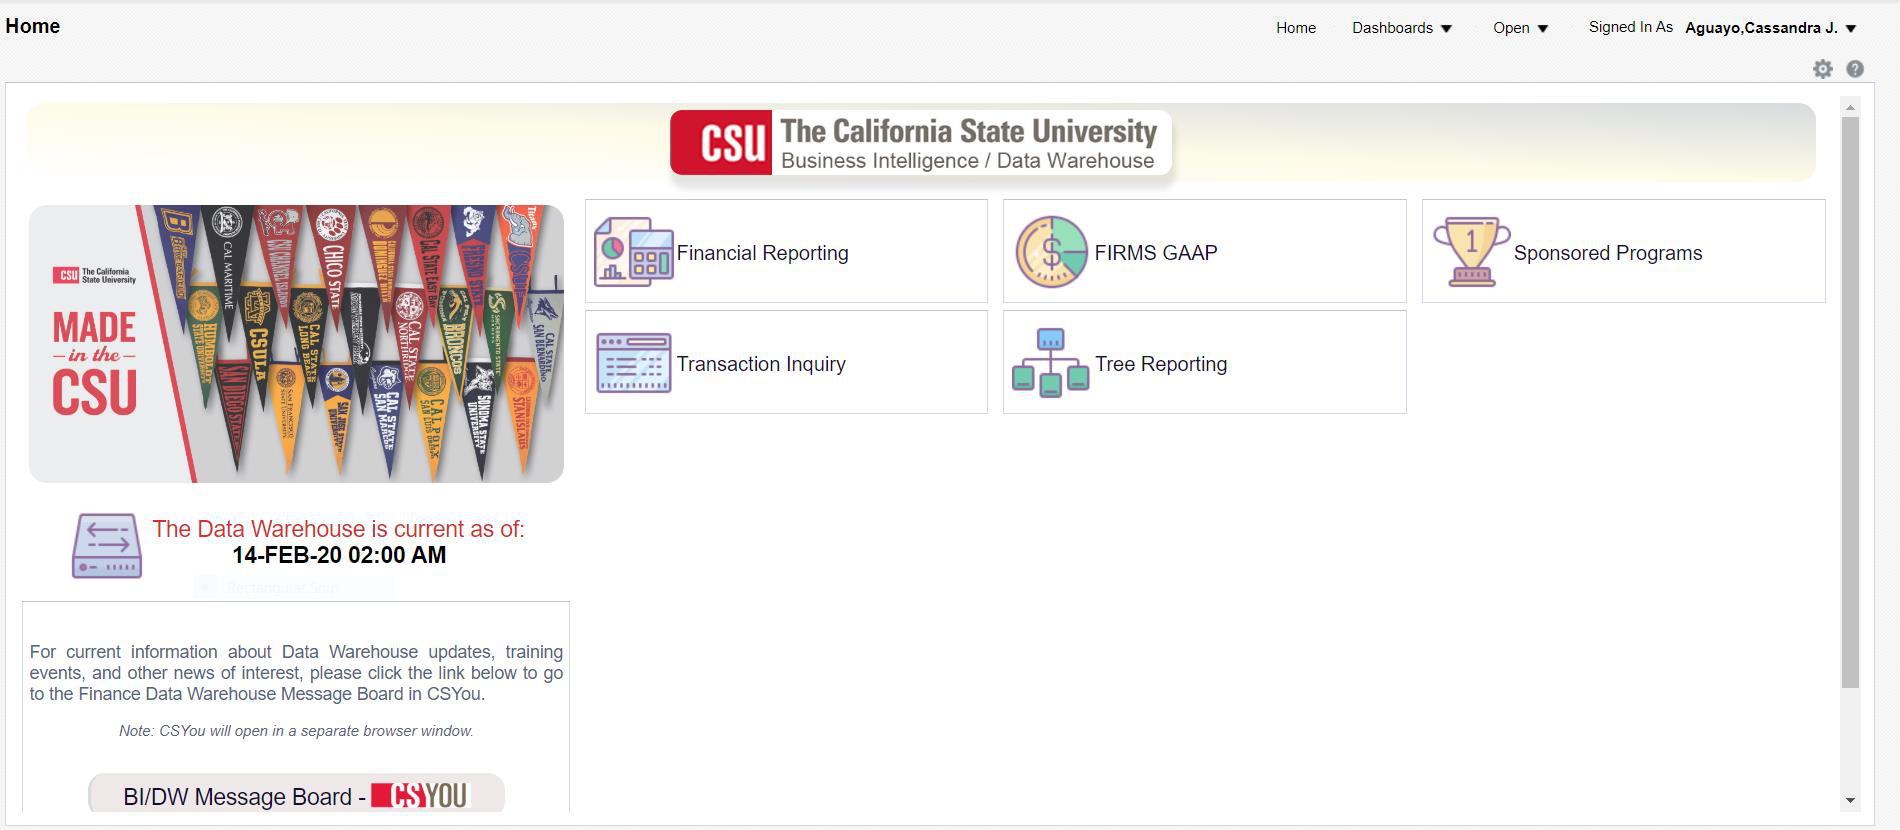
Getting Started - Dashboards
Or you can click the Dashboards drop down menu to display a list of available dashboards
Dashboard Choices:
- Financial Reporting
- Firms Gaap
- Sponsored Programs
- Transactions Inquiry
- Tree Reporting
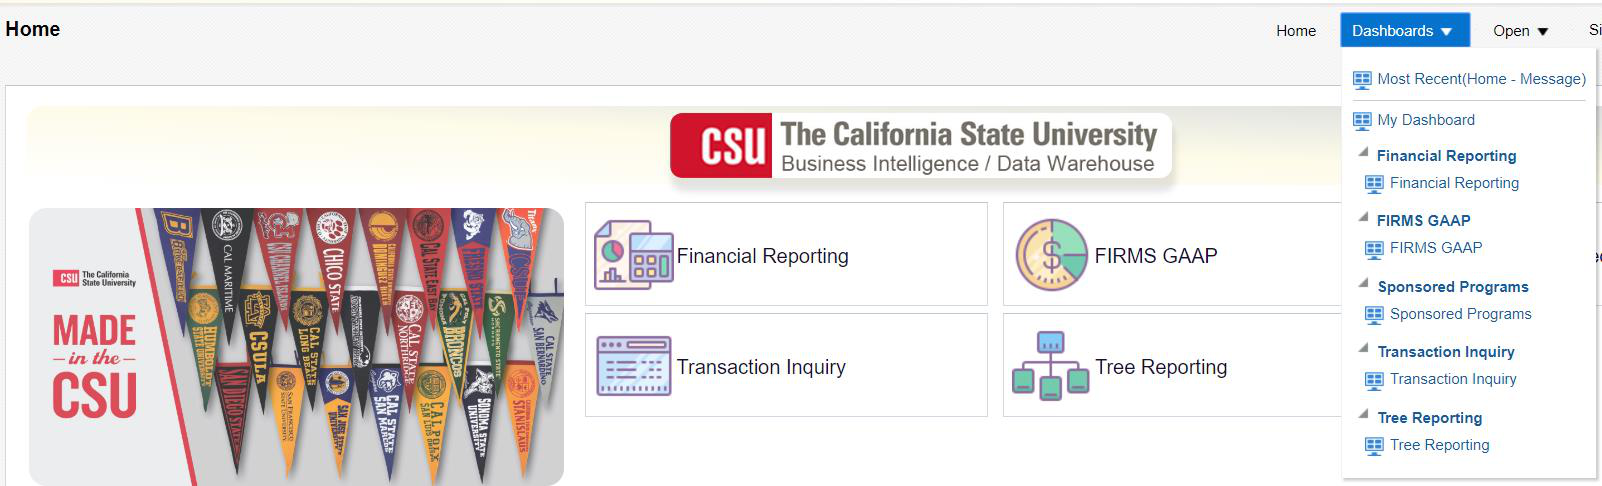
Your Primary Choices
- Your primary choices:
- Financial Reporting
- Transaction Inquiry
Your Primary Choices:
Financial Reporting
Transaction Inquiry
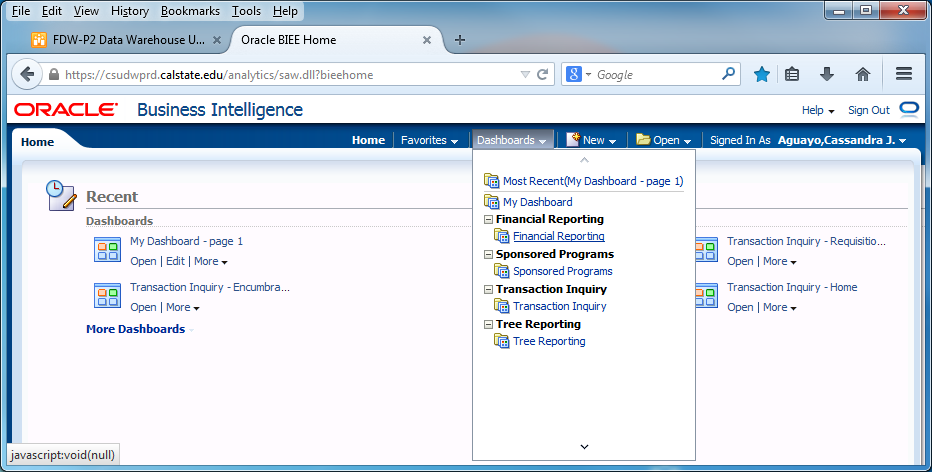
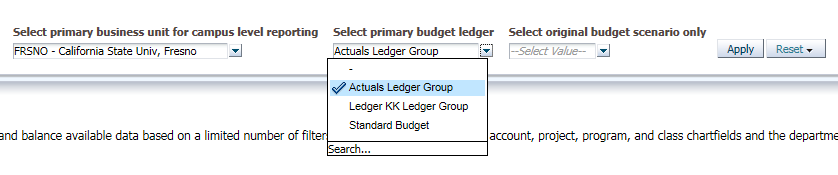
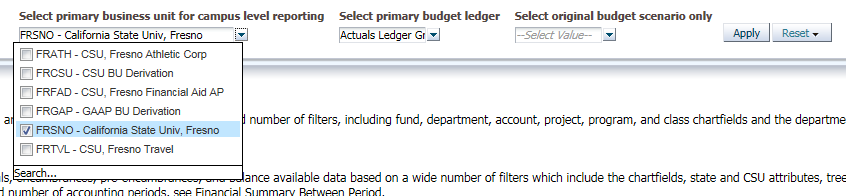
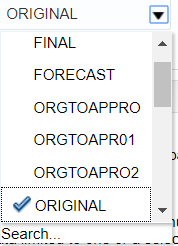
Getting Started – Establish Default Settings
- Select Business Unit
- Select Standard Budget
- Click Apply

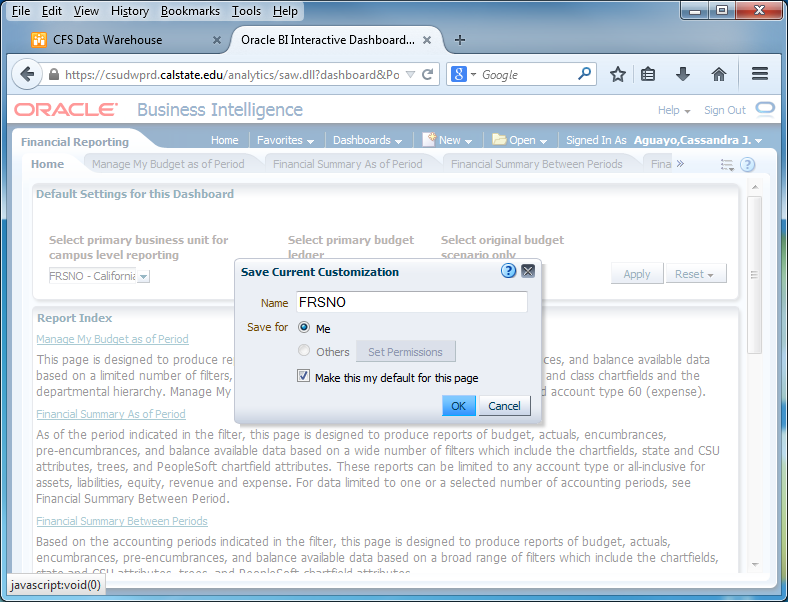
Save Current Customization
- Click Options Dropdown
- Save Current Customization
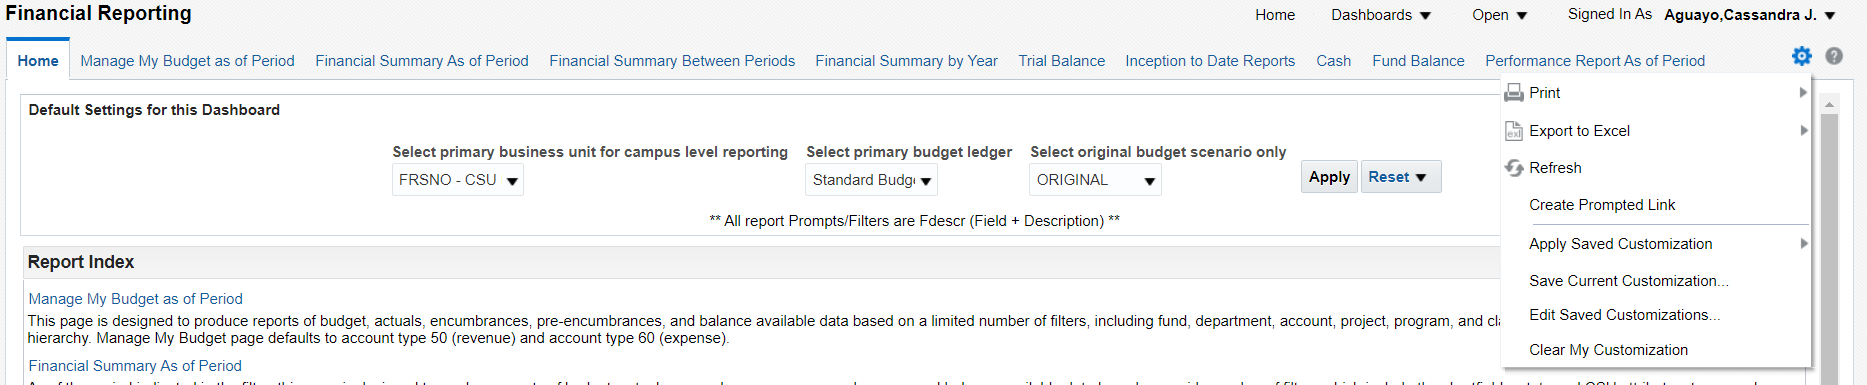
Make the Customization the Default
- Save as “FRSNO”
- Click the option “Me”
- Check the box “Make this my default for this page”
- Click “OK”
Getting Started – Manage My Budget as of Period
- The Basics: one Dept, one Fund report
- Set Filters:
- Business Unit- FRSNO
- Fiscal Year – accept default or make your selection
- Period – accept default or make your selection
- Account Type – normally defaults to 50 & 60
- Budget Ledger – normally defaults to Standard Budget
- Fund
- Department
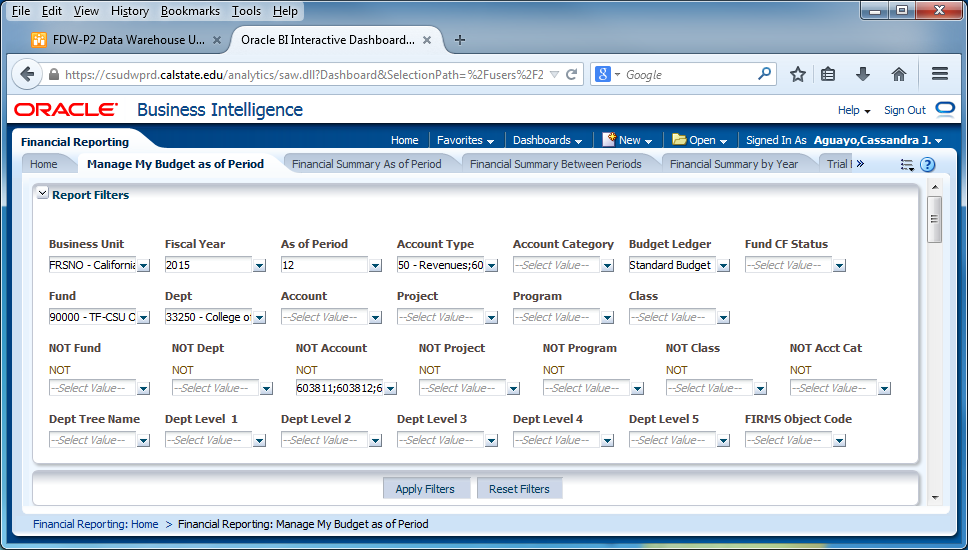
Manage My Budget as of Period
- Set Business Unit, Fiscal Year, Period, Account Type, and Budget Ledger
- Set Fund and Department
- NOT filters: Fund, Dept, Prog, Class & Not Acct Cat – use these filters if you do not want certain items included on the report…603811-603819 benefits
- Click Apply Filters
Save the Report Customization
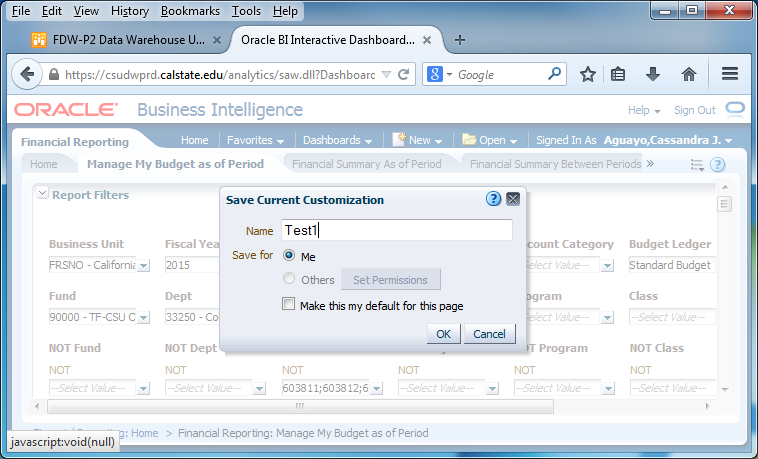
- Save your file by clicking the drop-down menu, select “Save Current Customizations”, name your file, and select “Me”
- Click “OK”

Report Results
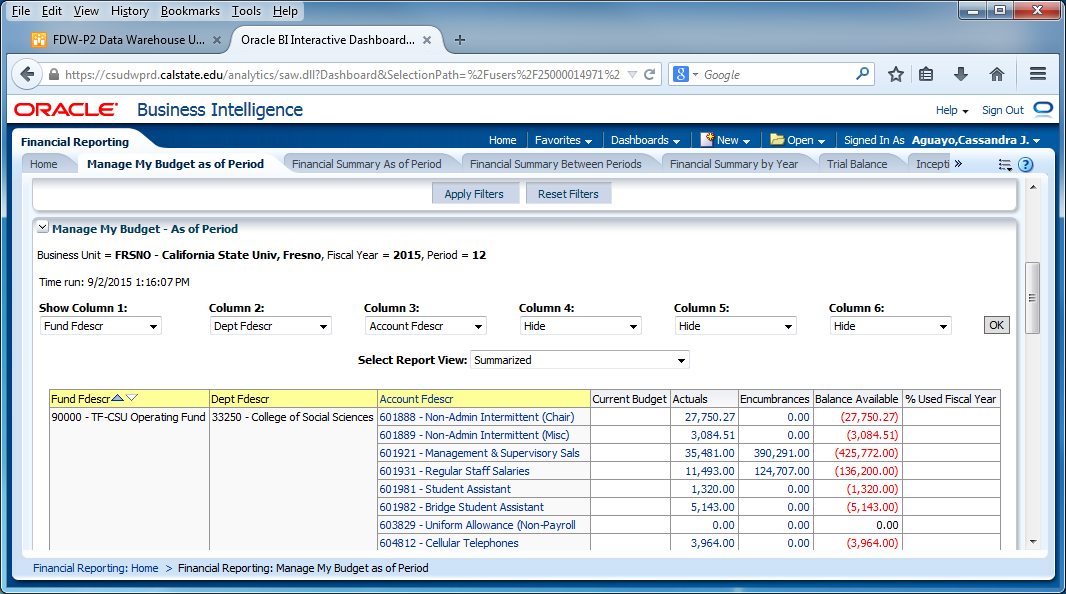
Enhanced Report Results Features:
- Reports will default to three visible columns
- Hide/unhide columns for up to as many as six columns
- Add/remove subtotals to any and all columns, as needed.
- Just as in the old version, results can be stored as a Saved Customization.
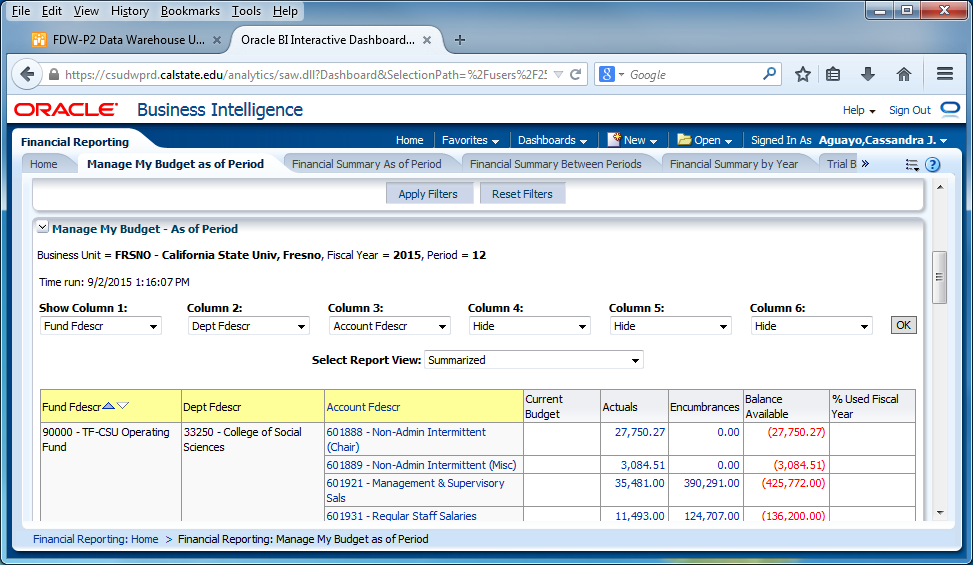
New Feature: Hide and Display Columns
- To Hide – simply click the drop-down menu on that column, click “Hide” and click “OK” for your selections to apply.
- To Display/add column – simply click the drop-down menu on the column you want to display and make your selections and click “OK” to apply the column values and generate the report.
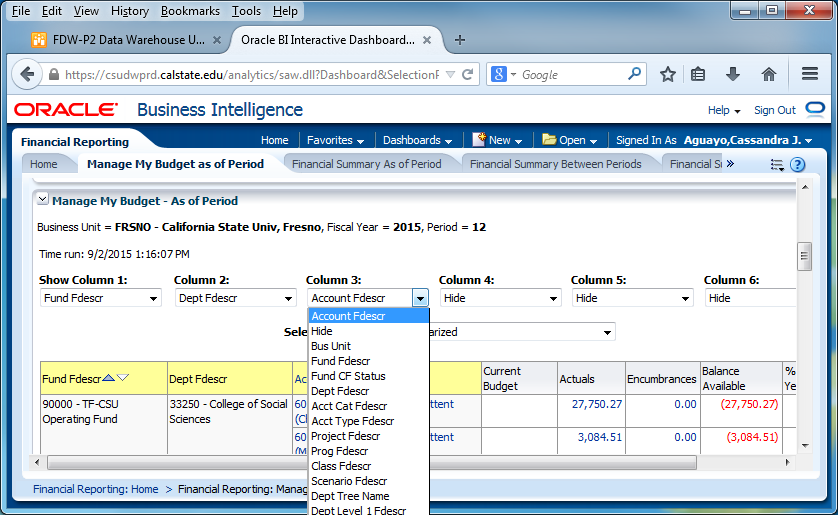
New Feature: Add/Remove Subtotals
- The first two columns in every report are formatted to display subtotals.
- To add subtotals:
- Place cursor at the top of column where you want to add subtotals to
- Right click on yellow column heading to access the Columns shortcut menu.
- Choose “Show Subtotal” and “> after values”
- To remove subtotals:
- Place cursor at the top of column where you want to remove subtotals from
- Right click on yellow column heading to access the Columns shortcut menu.
- Choose “Show Subtotal” or “None” to remove
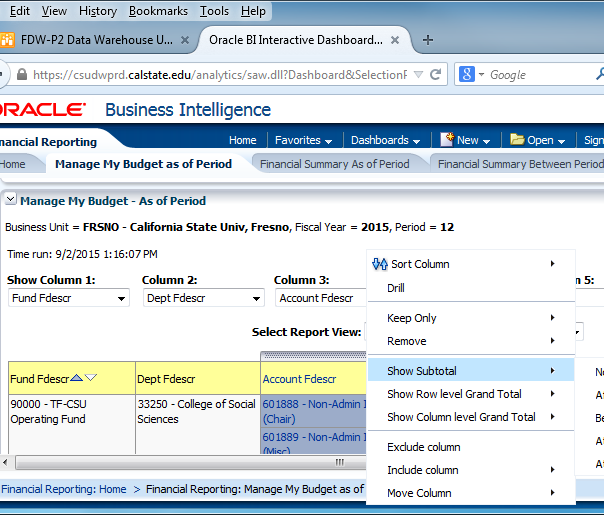
Drilldowns Improvement
- Drill down columns have been reformatted to have priority columns on the left, so they are easier to view.
- Additional fields have been added for Actuals and Budget drilldowns.
- Budget does not include PO or other Actuals specific columns
- Drilldown columns align on the left to the extent possible.
Actuals Drilldown Columns

Budgets Drilldown Columns

New Dashboard: Transaction Inquiry
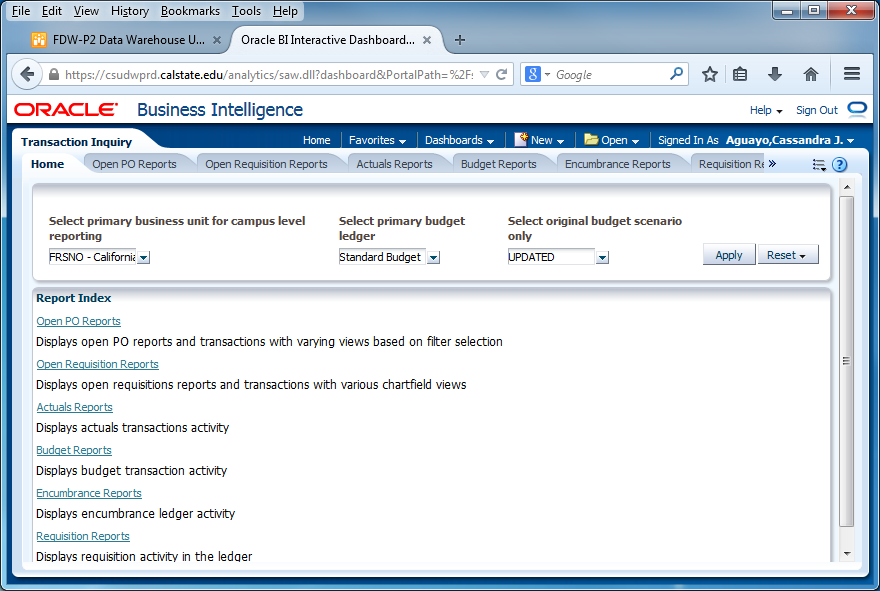
New Dashboard: Transaction Inquiry
- Open PO Report: Set your filters and apply
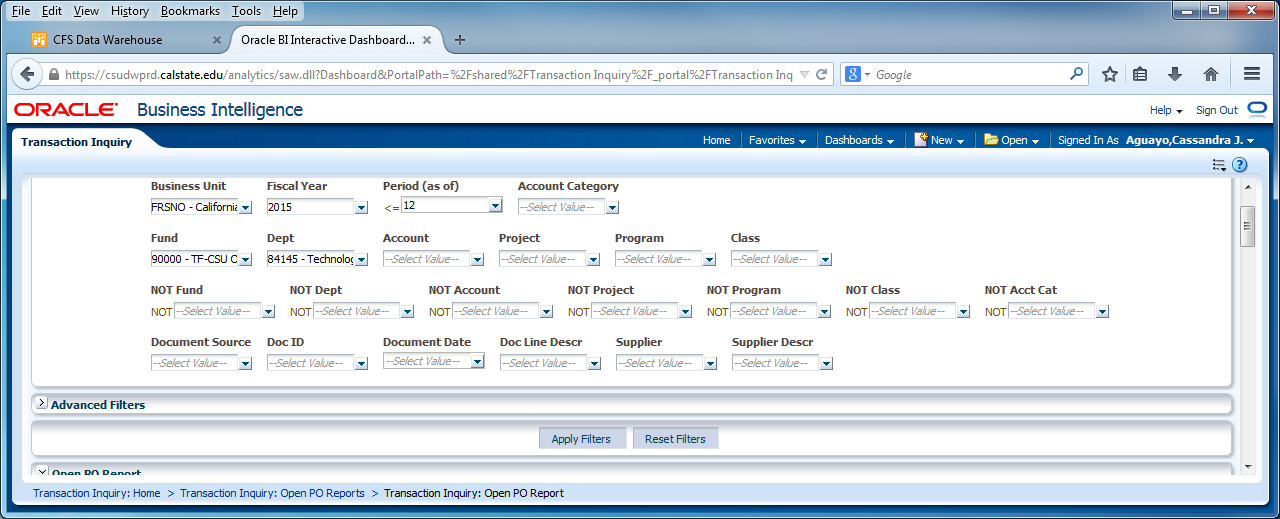
New Dashboard: Transaction Inquiry
- Open PO Report: Results
- Save
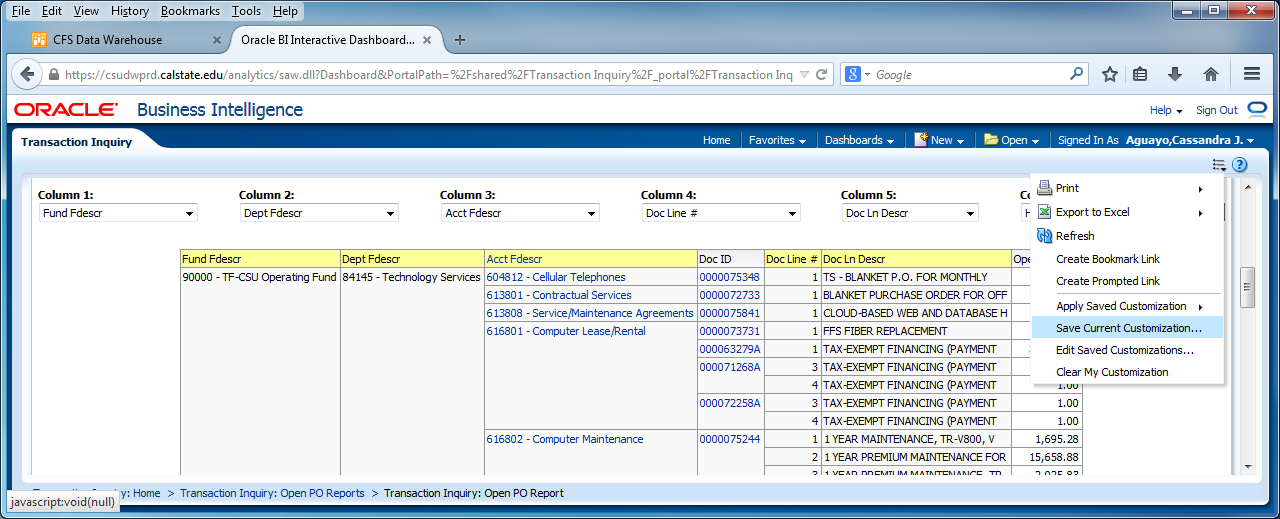
New Dashboard: Transaction Inquiry
- Actuals Transactions
- Actuals Reporting by Attributes
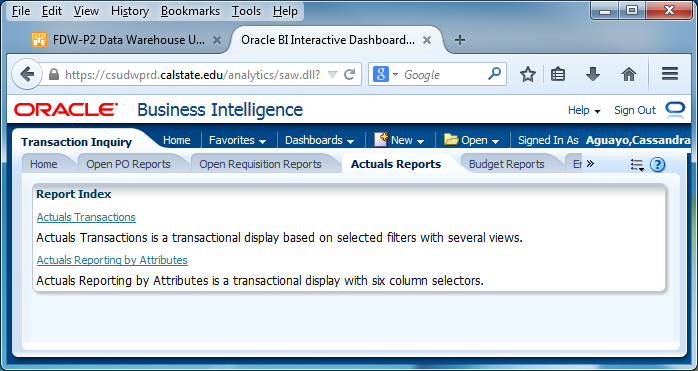
New Dashboard: Transaction Inquiry
- Actuals by Period
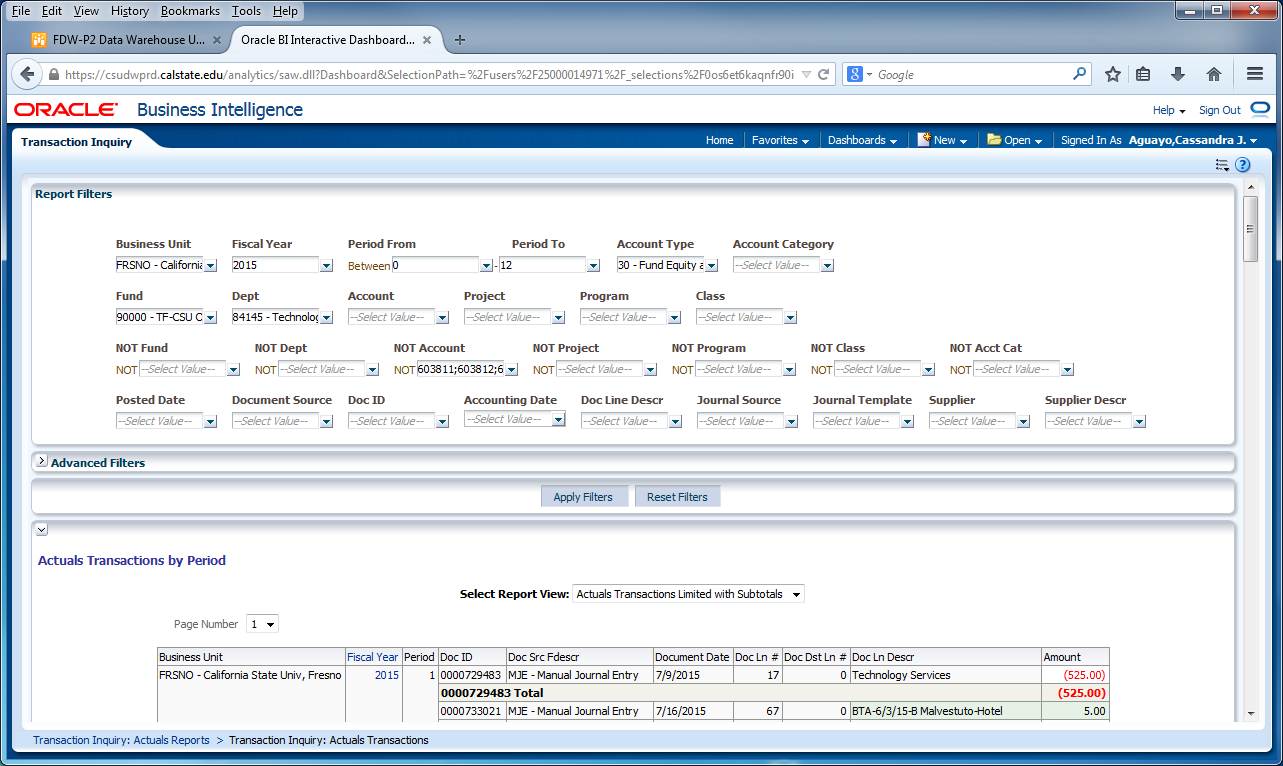
New Dashboard: Transaction Inquiry
- Actuals Reporting by Attributes
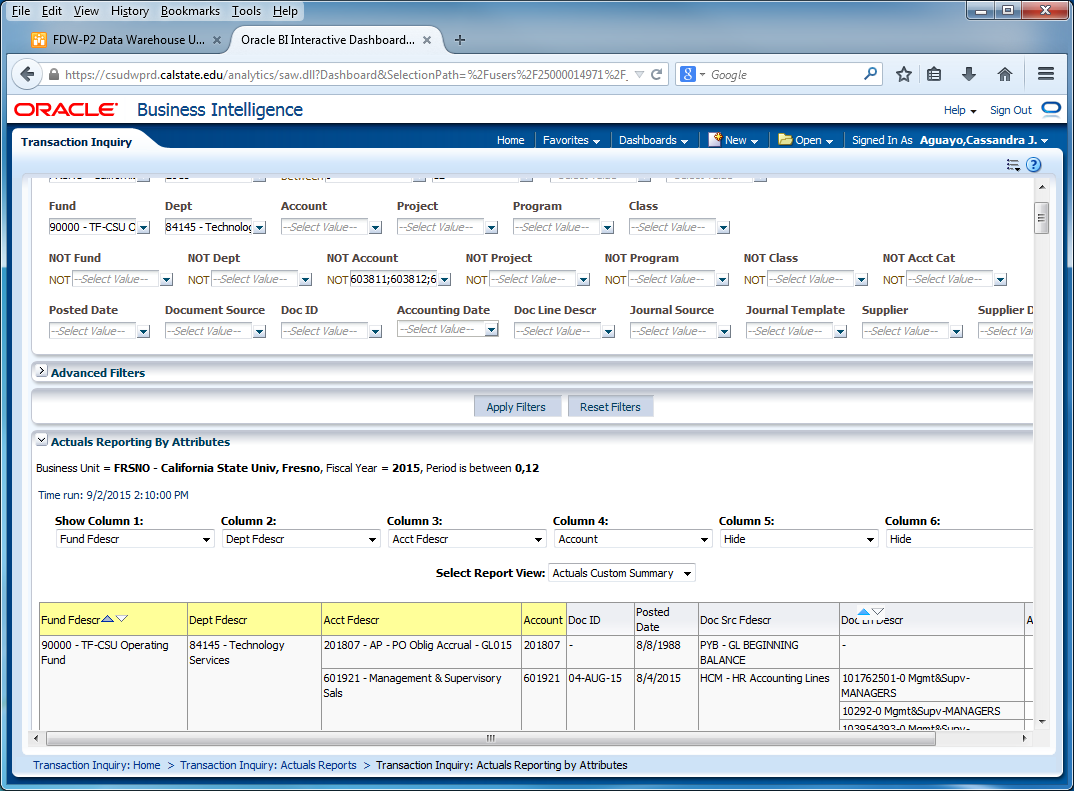
New Dashboard: Transaction Inquiry
- Budget Transactions
- Budget Reporting by Attributes
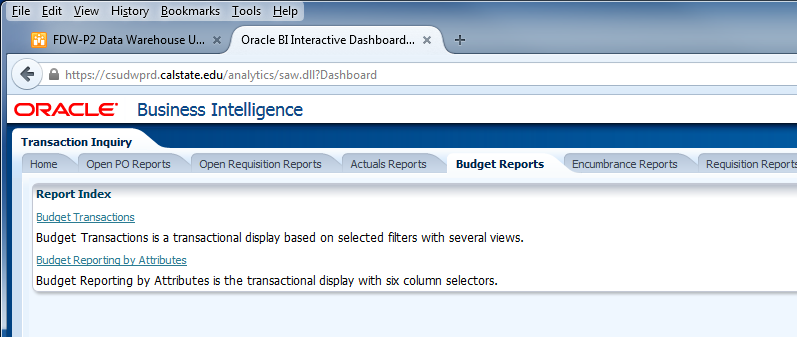
New Dashboard: Transaction Inquiry
- Budget Transactions
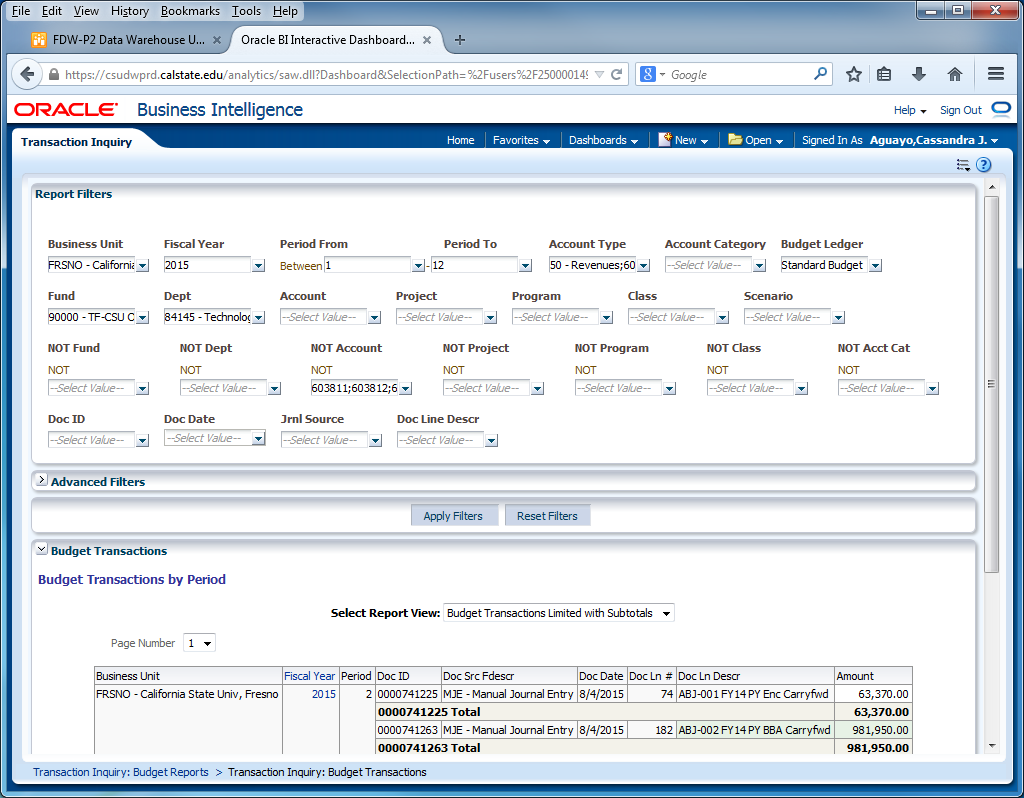
New Dashboard: Transaction Inquiry
- Budget Reporting by Attributes
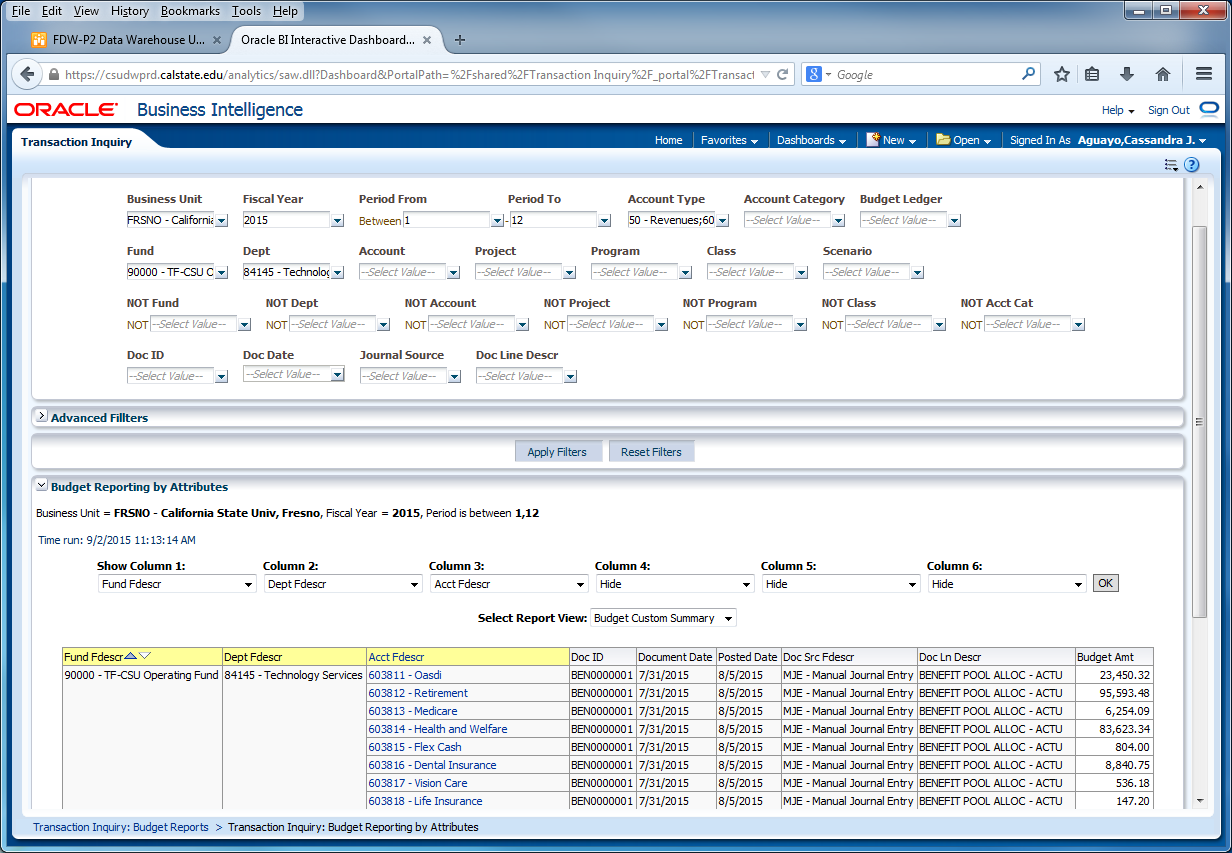
New Dashboard: Transaction Inquiry
- Encumbrance Transactions
- Encumbrance Reporting by Attributes
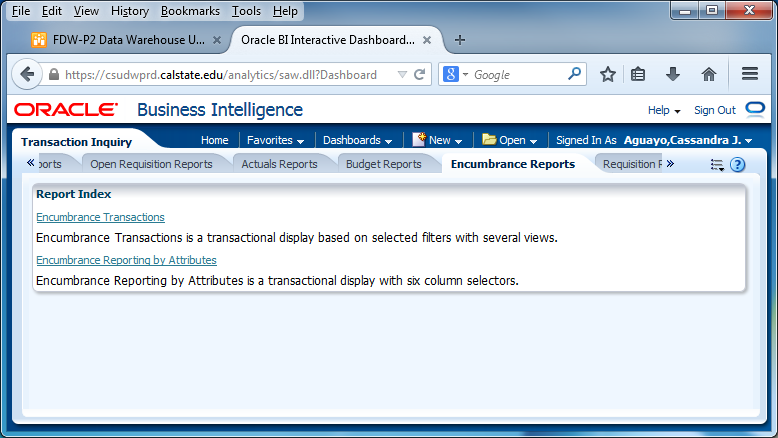
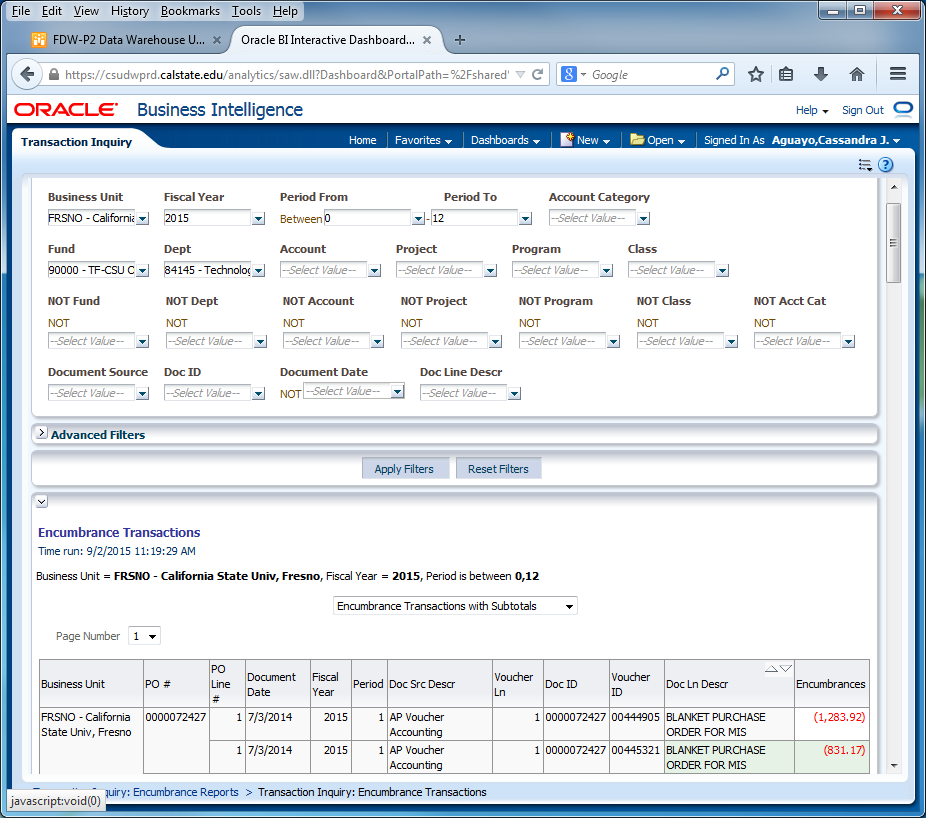
New Dashboard: Transaction Inquiry
- Encumbrance Transactions
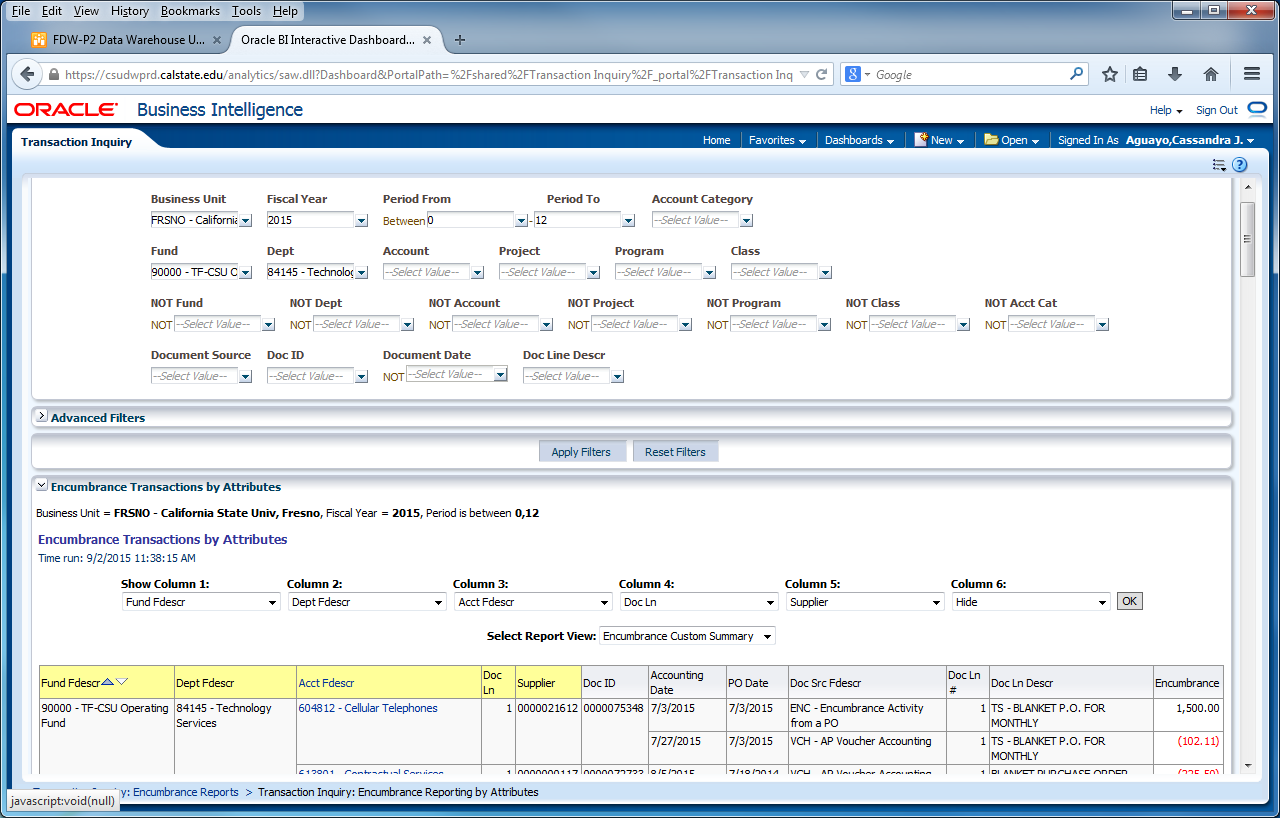
New Dashboard: Transaction Inquiry
- Encumbrance Reporting by Attributes
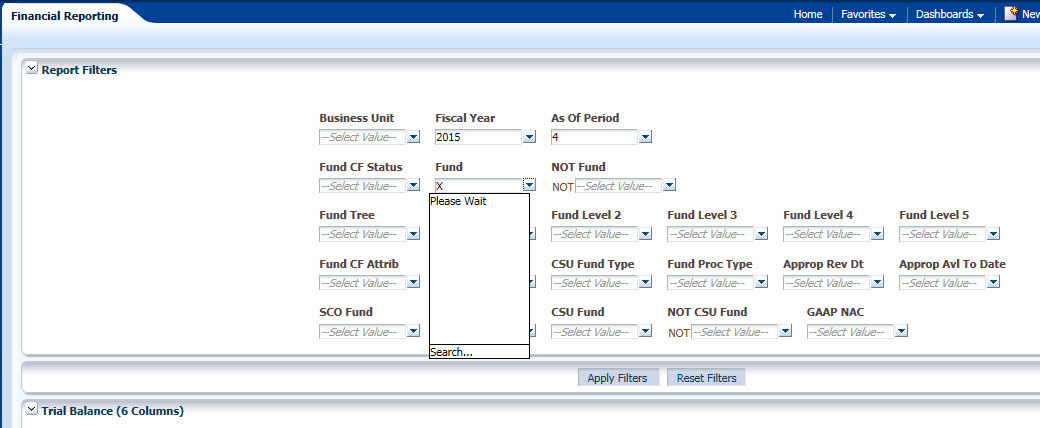
Trial Balance Selections
- This report is best used for Fund only views
- Prompt filter has down arrow. It will default to current period and year unless it is a save selection report. (Hint: Save as Period 12)
- Multiple Funds can be selected for this report. (Departments cannot be filtered in this)
- Click Apply Filters
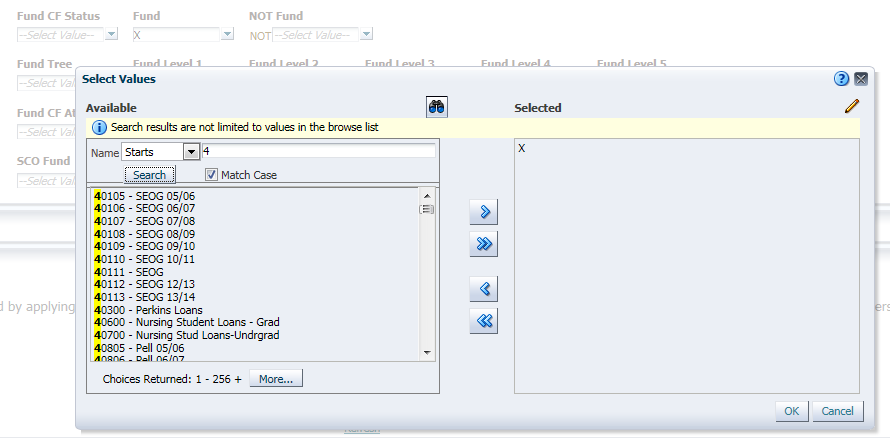
Report Filters – Fund Selection Criteria
- Double-click on any value to move it into or out of the Selected box or use the arrow button.
- Enter first number of Fund to list all with that beginning number.
- Search is available in drop down box for ‘Starts’, ‘Contains’, ‘Ends’, and ‘Is Like’. Unselect Match Case for more options. It does not identify the description. There is limited criteria in the selection box. If your search contains more . Remember to select ‘Search’.
- When more than 256 results, hit the “More” button to display the next 256 choices. Otherwise, you may not find your choice. It is easier to use the ‘Search’ than to scroll.
- Click ‘Ok” to save.
Selection Buttons
Use the buttons below to move items into the Selected Box.
- De-select all items.
- De-select highlighted item(s)
- Select all items listed
- Select highlighted item(s)


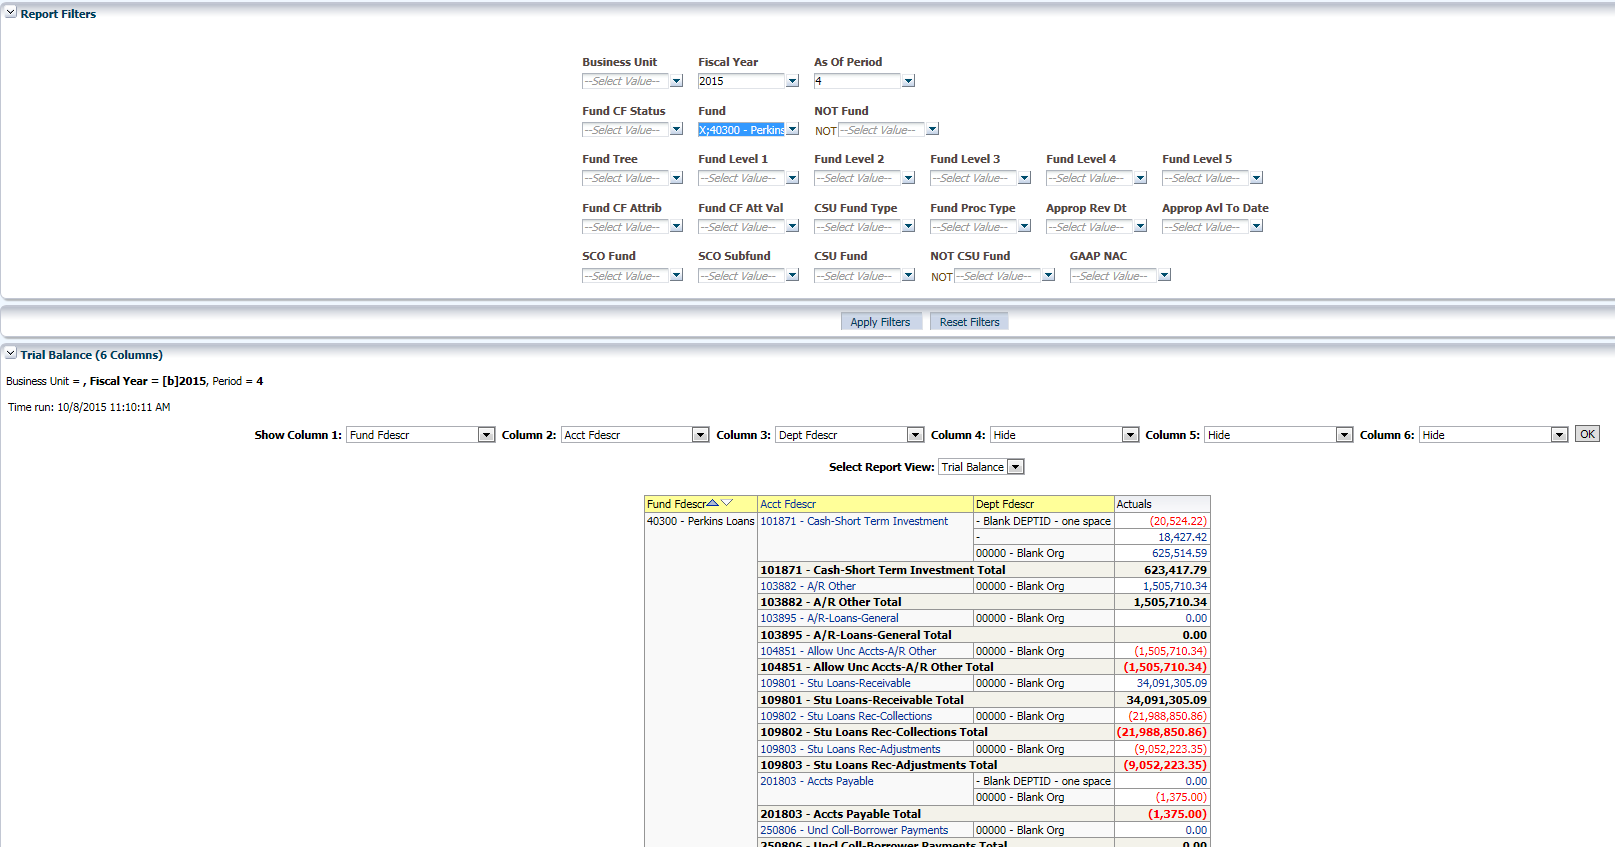
Trial Balance (6 columns)
- This report is good to view the available cash balance
- In the 6 Column Trial Balance, various columns can be added to suit different reporting needs
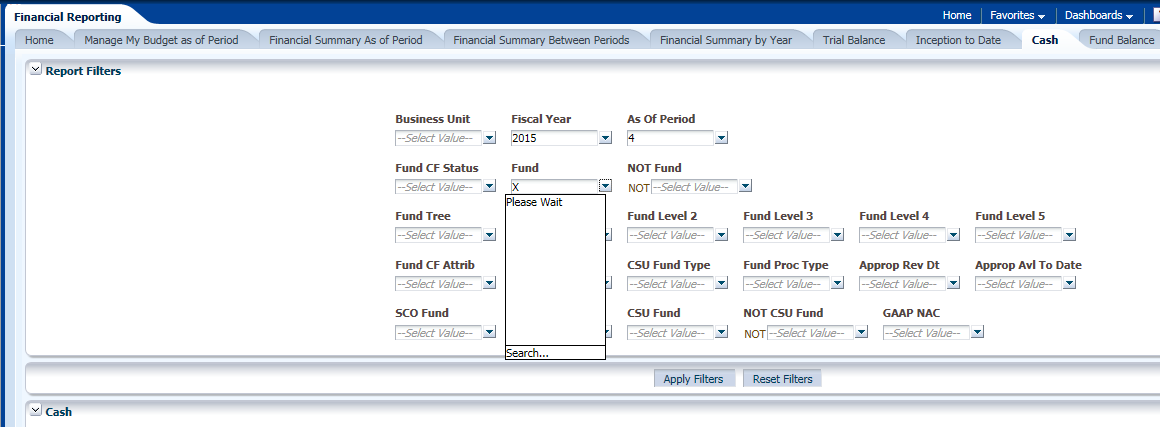
Cash Balance Report
- Choose your Fund Number
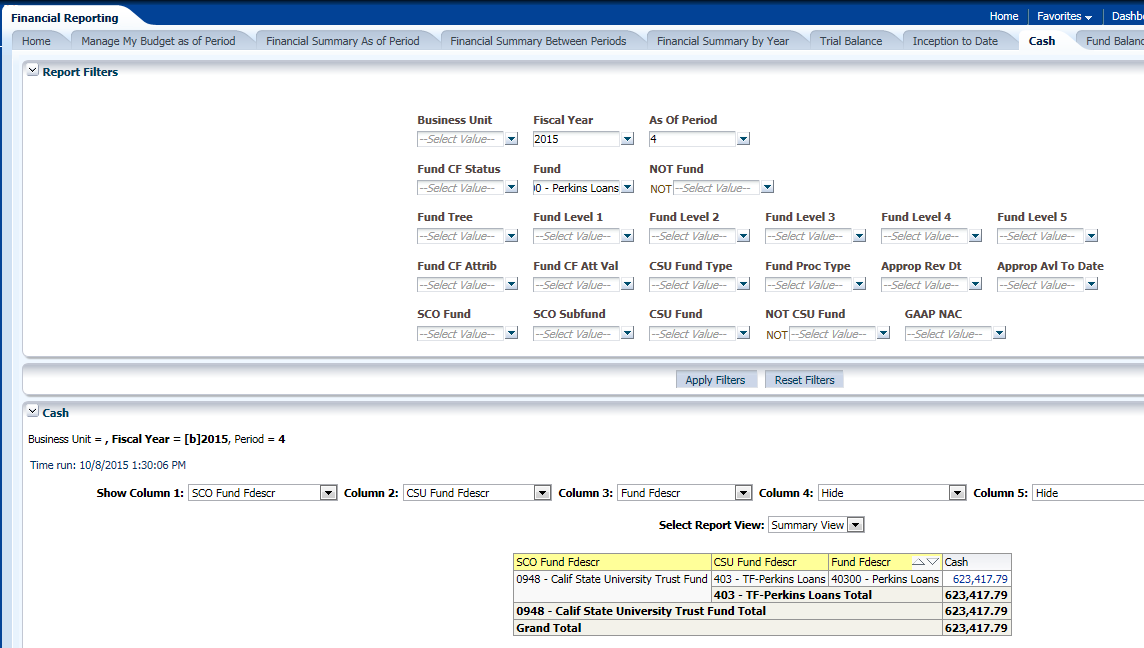
Cash Report
- Balance will show in Cash column. Report will only show the Cash balance.
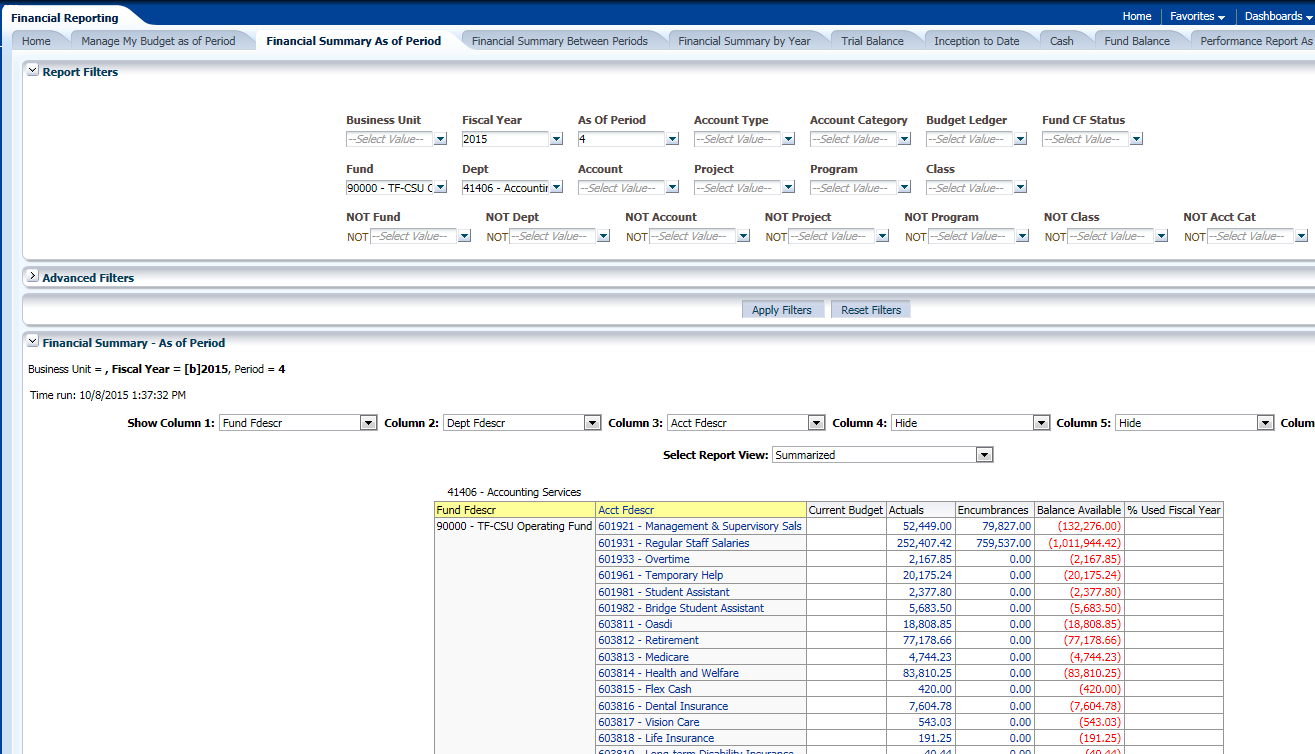
Financial Summary As of Period
- You can drill down for detailed information, in any field that shows an underline when you scroll over it
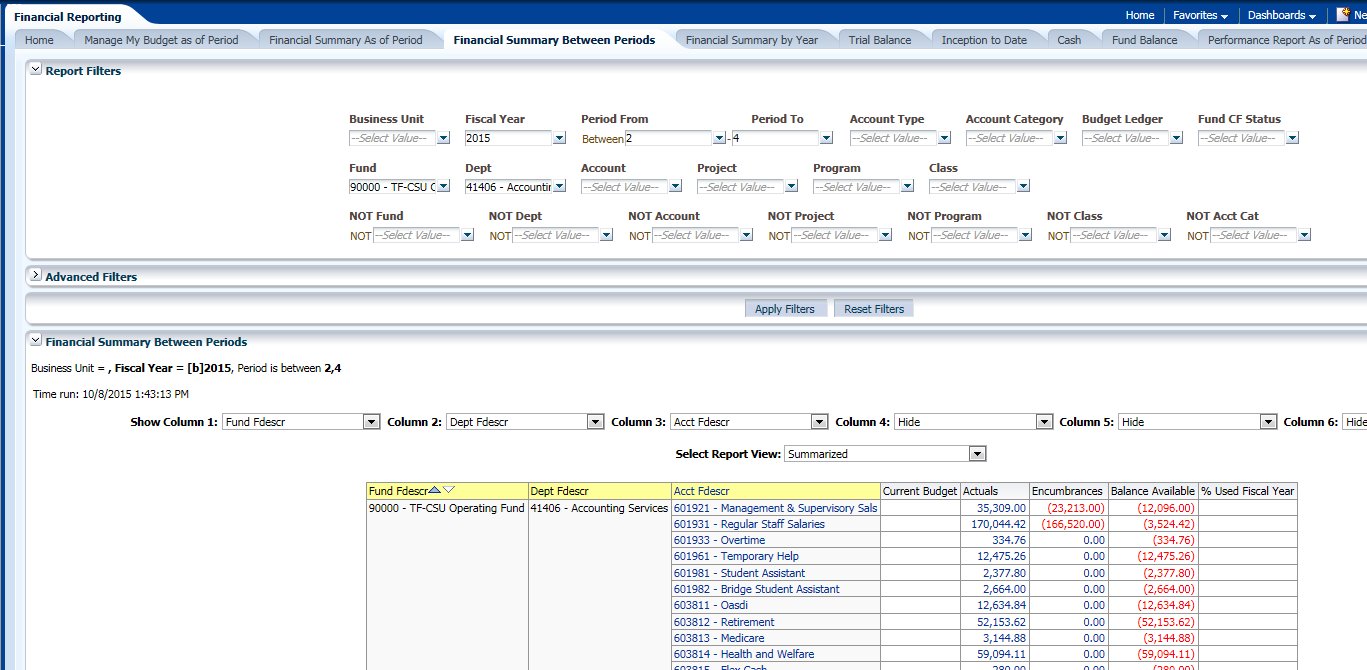
Financial Summary Between Periods
- Report is similar to Financial Summary As of Period, but it allows the user to choose periods to view
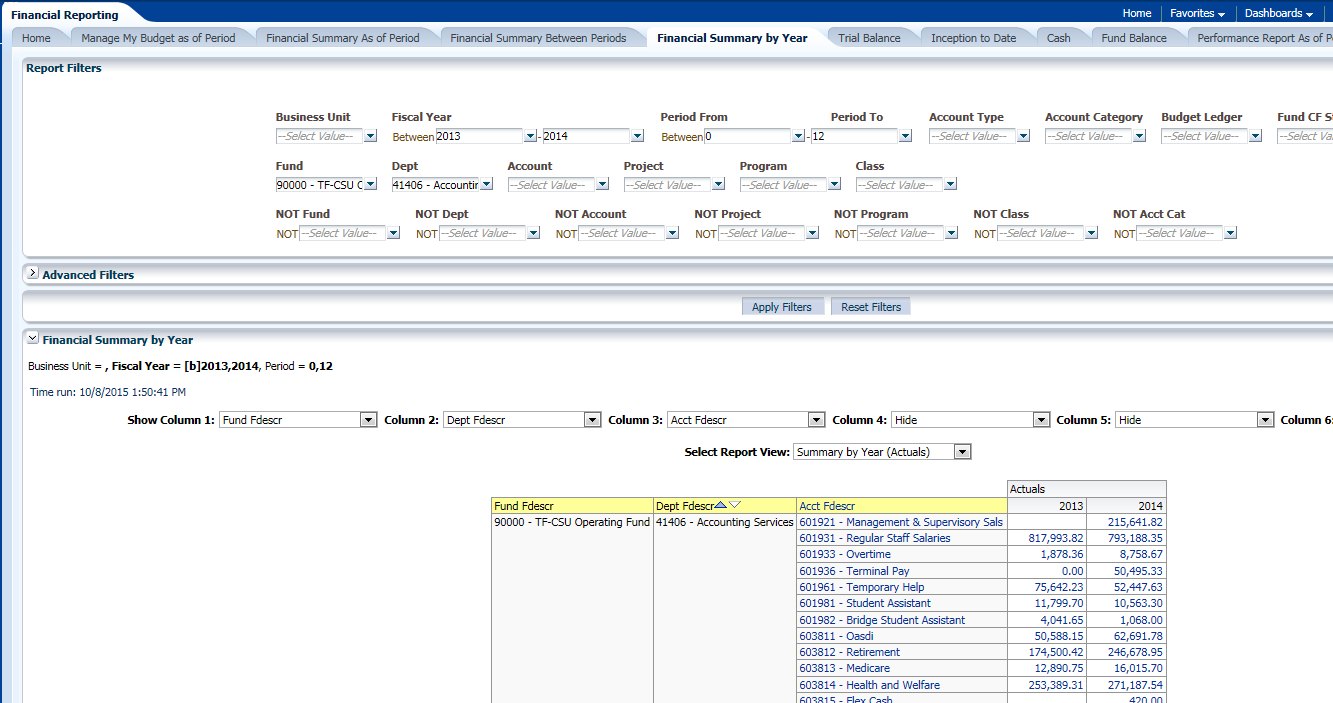
Financial Summary by Year
- Compares fields year by year. Periods and Department field can also be filtered.
- Select years and periods to compare
- Select Column order for the report
- Shows amounts posted from year to year and it allows the user to drill down
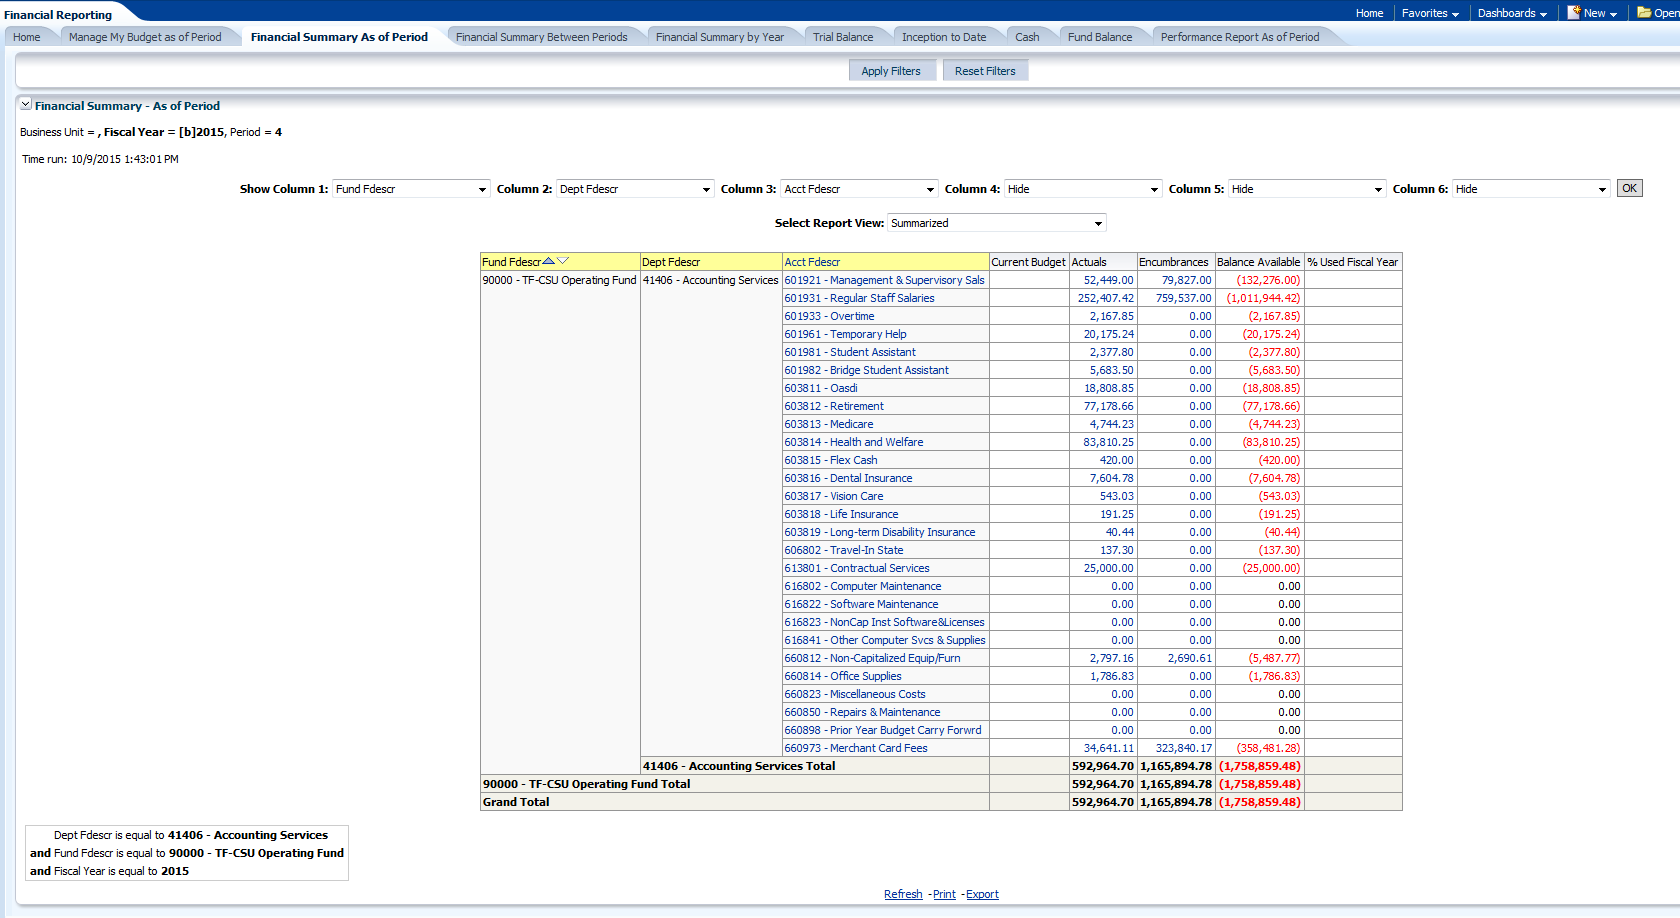
Export and Print
- Example is from Financial Summary As of Period
- Refresh, Print, and Export options are at the bottom of the page
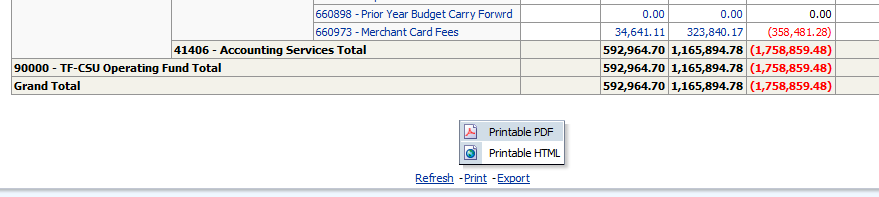
Print to PDF
- The Print hyperlink located beneath the report will print the individual report in either PDF or HTML formats. Both are similar
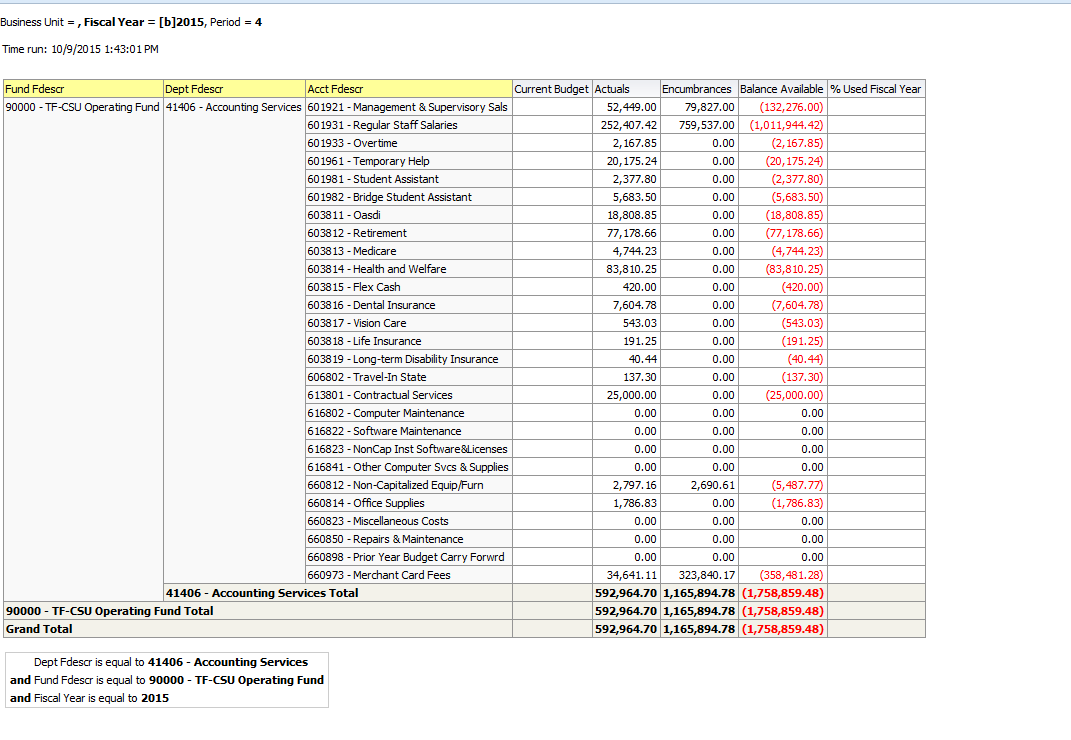
Print to HTML Results
- Printing to HTML provides a printout screen similar to a screenshot. The result is a smaller output which can fit to one page
Exporting Data
- Exports all data on the screen to a variety of file formats including PDF, Excel, & CSV.
- Exporting to PDF results in a file similar to the print to PDF, but it can be saved as a file.
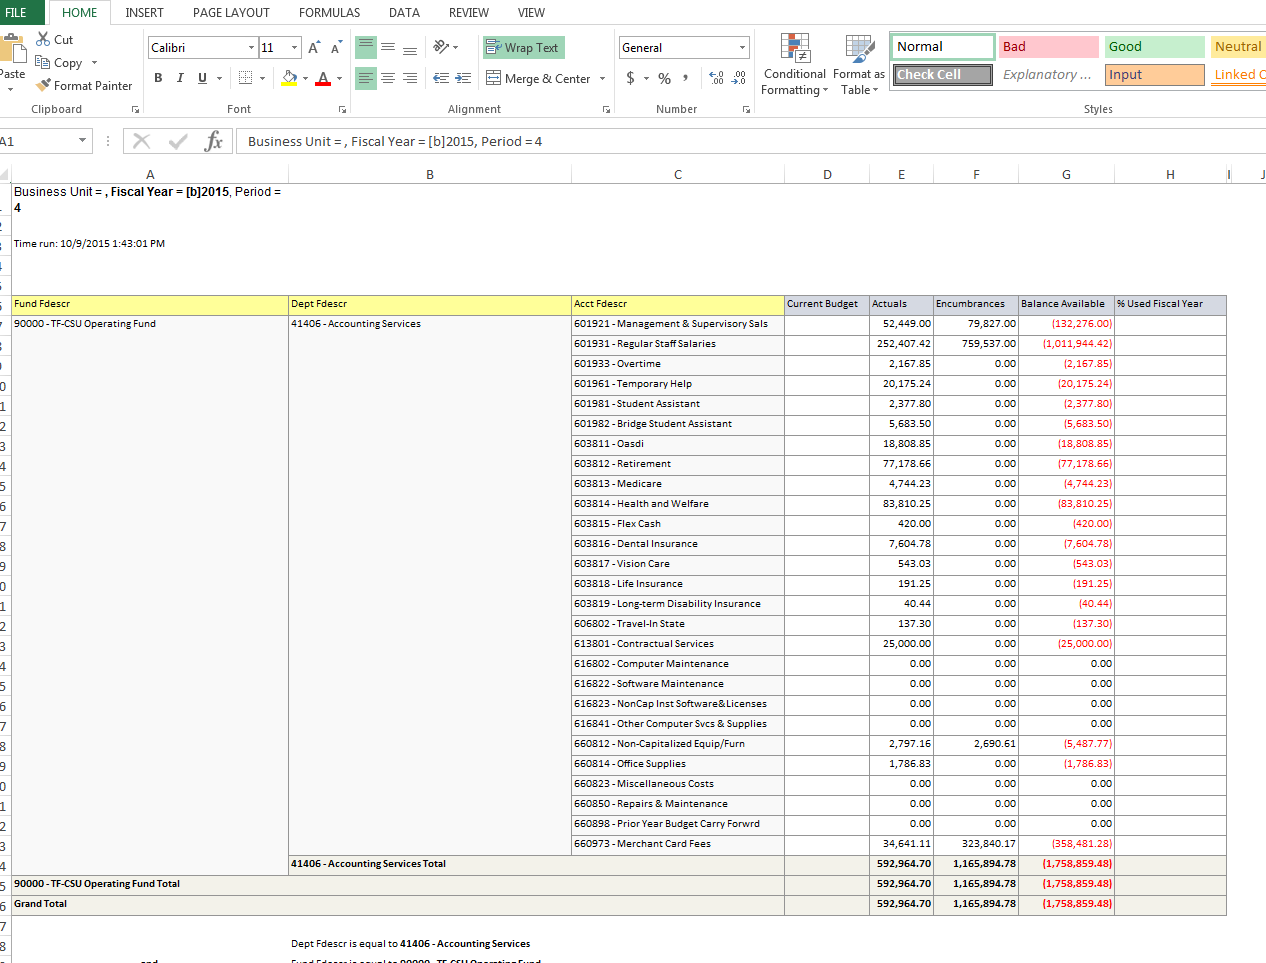
- Exporting to Excel presents the data in Excel along with report formats. Formulas are not transferred to Excel. It is only hardcoded numbers.
- Tab Delimited and CSV files will open in Excel without any formatting and can then be saved as an Excel file. Be sure to save as an Excel file. This export may include more data than shown on the screen.
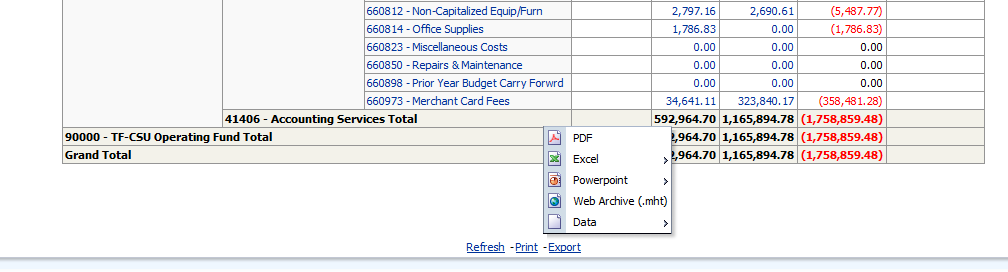
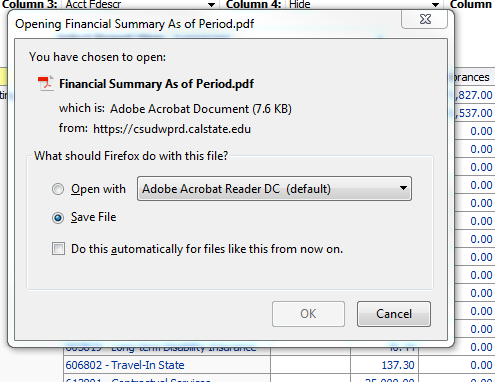
Example of Export to PDF
- This is a good tool to send the report to a manager
- Select PDF as Export file type
- After selecting the PDF file, a box will pop up asking to either open or save the file. Either option will work.
- Click OK
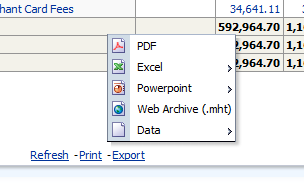
Example of Export to Excel
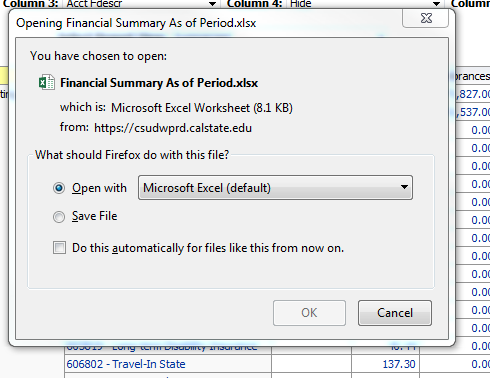
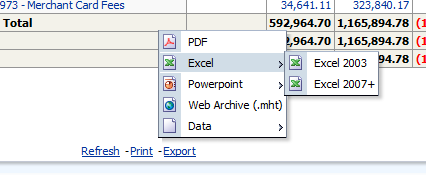
- Select Export to Excel. Then select the Excel 2007+ format.
- After selecting the Excel file as output, a box will either open or save to file. Either option will work.
- Click OK
Example of Export to Excel Data Output
- The data is downloaded into Excel. The formatting can be manipulated from this point and can be saved as an Excel file.
- Formulas do not carry forward. Numbers are hardcoded.
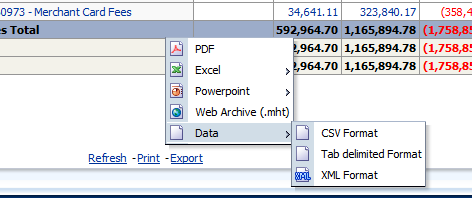
Example of Export to Data – CSV Format
- Select Export to Data – CSV Format
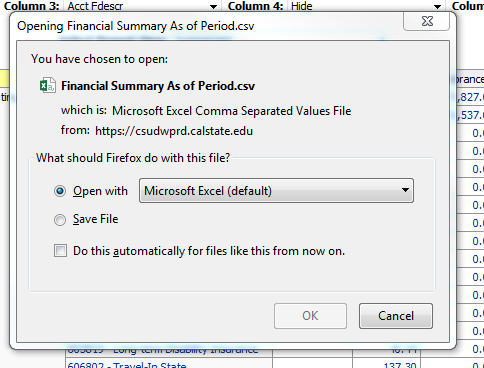
- Prompt will open the CSV file with Excel. There is also an option to save the file. Opening in Excel is recommended.
Example of Export to Data – CSV Format Output
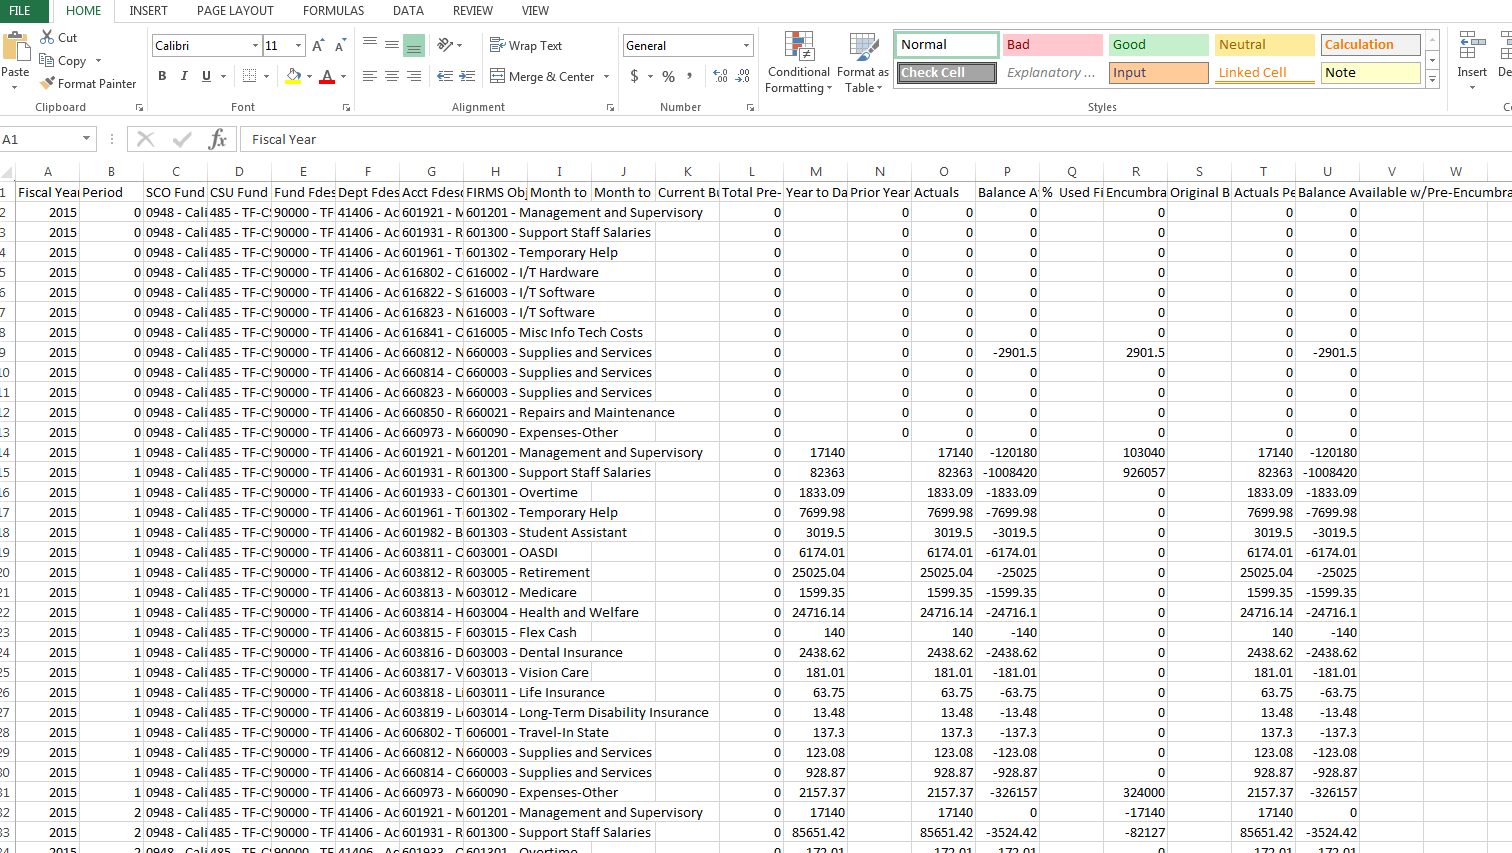
- The CSV file opens to Excel as unformatted data. It can be manipulated from this point. Data includes information such as additional fields which may not be seen on the original output screen.
- Remember to save the file as an Excel file when finished formatting
Questions?
Contact Information
Office of Budget & Resource Planning
Jean Aguayo jaguayo@csufresno.edu 559-278-7224
Lisa Chavez lisachavez@csufresno.edu 559-278-5293
Jeffrey Blanks jeffblanks@csufresno.edu 559-278-6123
Accounting Services
P.J. Soligian pjsoligian@csufresno.edu 559-278-8133
Cherie Weber cweber@csufresno.edu 559-278-4144
This HTML version was generated with AI assistance and may contain errors or omissions. The original approved PDF remains the official document of record. An alternative accessible format is available upon request from the document creator in accordance with Title II of the ADA.